
Box, the fast-growing cloud storage and collaboration tool provider, is candid about where it stands on the infrastructure cost component for Cloud delivery.
In its recent S1 filing, Box states,“ If we overestimate the demand for our cloud-based storage service and therefore secure excess data center capacity, our operating margins could be reduced. If we underestimate our data center capacity requirements, we may not be able to service the expanding needs of new and existing customers and may be required to limit new customer acquisition, which would impair our revenue growth.’’
In other words, it’s damn if you do and damn if you don’t spend enough on Cloud infrastructure.
The dilemma facing Box as well as other listed in our Cloud Top 500 database is the catalyst behind our latest research study to find out how much these vendors spend on their Cloud infrastructure, which accounts for the bulk if not the entirety of their cost of revenues.
The result is an in-depth analysis of how much do the publicly-traded companies spend on cost of revenues – which cover mostly infrastructure costs for facilities, data centers as well as servers, storage and other equipment needed to run such Cloud applications on behalf of their customers. We also compare their costs with those from privately-held vendors through surveys, interviews and published figures.
On average, Cloud Top 500 applications vendors now spend about 25% of their Cloud subscription revenues on infrastructure costs.
In the case of Salesforce.com, the largest Cloud applications vendor, the figure stood at 17% for its fiscal 2014.
Oracle, for example, spent about 44% in operating expenses for its Cloud applications and platform business in its latest quarter.
For many vendors, their infrastructure spend keeps rising. Ellie Mae, for example, plans to spend 36% more on infrastructure costs in 2014 than what it spent last year. Similarly, Zendesk, which sells customer service applications, doubled its cost of revenues in the second quarter of 2014 over the year-earlier period.
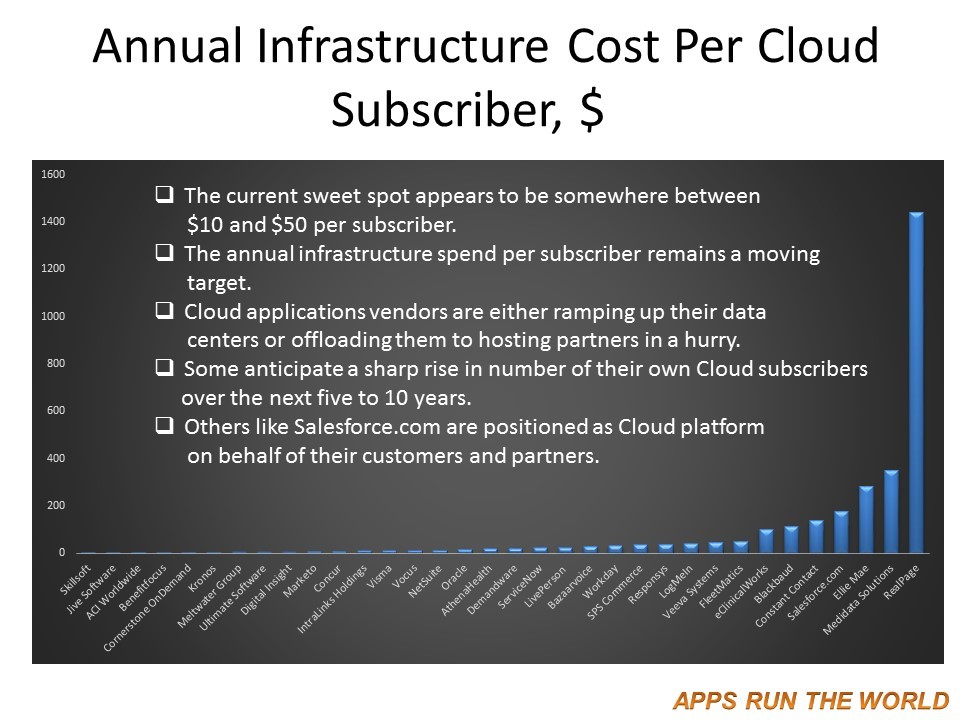
What follows is a table that lists the top and least spenders among the Cloud Top 500 applications vendors when it comes to their annual infrastructure spending per subscriber.
Table 1 – Highest Annual Infrastructure Spend Per Subscriber
By Cloud Top 500 Applications Vendors, 2013
| Highest Spend Vendors | Infrastructure Costs In Calendar Year 2013, $M | No. of Cloud Subscribers | Annual Infrastructure Cost Per Cloud Subscriber, $ | Key Market | Comments |
|---|---|---|---|---|---|
| RealPage | 144 | 100000 | 1440 | Real Estate Management | SEC filings |
| Medidata Solutions | 35 | 100000 | 350 | Life Sciences Operations Management | SEC filings |
| Ellie Mae | 33 | 116000 | 284 | Banking and Financial Services | SEC filings |
| Salesforce.com | 713 | 4000000 | 178 | CRM | SEC filings |
| Dealertrack | 277 | 2000000 | 138.5 | Automotive Dealer Automation | SEC filings |
| Constant Contact | 82 | 600000 | 136.6 | CRM | SEC filings |
| Model N | 5 | 40000 | 125 | Revenue management | SEC filings |
| 2U, INC. | 11.2 | 100000 | 112 | Education | SEC filings(Half of technology and content development costs) |
| eClinicalWorks | 55 | 545000 | 100.9 | Clinical Systems | Based on 25% average infrastructure spend among Cloud Top 500 to eClinicalWorks’ Cloud subscription revenues, substantially lower than 43% at its rival Athenahealth. |
| Blackbaud | 93 | 1000000 | 93 | CRM | SEC filings |
Table 2 – Least Annual Infrastructure Spend Per Subscriber
By Cloud Top 500 Applications Vendors, 2013
| Least Spend Vendors | Infrastructure Costs In Calendar Year 2013, $M | No. of Cloud Subscribers | Annual Infrastructure Cost Per Cloud Subscriber, $ | Key Market | Comments |
|---|---|---|---|---|---|
| Kronos | 15 | 3000000 | 5 | HCM | Company reports |
| Halogen Software | 8.3 | 2000000 | 4.2 | HCM | SEC filings |
| Zendesk | 25 | 6000000 | 4.2 | CRM | SEC filings |
| Cornerstone OnDemand | 63 | 14000000 | 3.8 | HCM | SEC filings |
| ACI Worldwide | 32.8 | 10000000 | 3.3 | Online Banking | Based on 25% average infrastructure spend among Cloud Top 500 to ACI Worldwide’s Cloud subscription revenues, substantially lower than 71% at its rival Q2ebanking. |
| Benefitfocus | 61 | 20000000 | 3.1 | CRM | SEC filings |
| Jive Software | 38 | 15000000 | 2.5 | Collaboration | SEC filings |
| Cvent | 32 | 20500000 | 1.6 | Collaboration | Based on 205,000 events under managed in 2013 and an estimated 100 attendees per event |
| Skillsoft | 21.8 | 19000000 | 1.1 | eLearning | Based on 25% average infrastructure spend among Cloud Top 500 to Skillsoft’s Cloud subscription revenues, substantially lower than 37% at its rival Cornerstone Ondemand |
| Opower | 31 | 50000000 | 0.6 | Utility | 50M meters under management |
The inevitable question is whether these Cloud applications vendors are spending their infrastructure dollars effectively to support the largest possible number of Cloud users by providing them with easy access to their applications.
Salesforce.com’s Spend Per Subscriber
Salesforce.com, one of the pioneers of Cloud applications, started delivering customer relationship management applications via the Cloud in 2000 when it signed 1,500 customers and fewer than 30,000 subscribers. Cost of revenues, which mostly went to infrastructure expenses, in its fiscal 2001 was less than $1 million on sales of about $5 million.
Now with more than 150,000 customers and an estimated four million subscribers, Salesforce.com spends considerably more, averaging about $178 per subscriber per year, as shown in table 1.
Assuming the base of subscribers to reach eight million including those from Salesforce.com’s platform customers – mostly ISVs that leverage its infrastructure to support hundreds or thousands of their subscribers, the per subscriber per year in infrastructure cost would hover around $78, which is still higher than that of Cloud Top 500, which averages about $53, according to the latest research from Apps Run The World.
It’s possible that Salesforce.com has finally been able to contain its infrastructure costs. In its latest quarter ended October 31, Salesforce.com’s cost of revenues grew 20% on a 28% jump in Cloud subscription revenues, which include both of its applications and platform sales.
Still it’s not clear whether its cost control is sustainable. In the trailing four quarters ended October 31, Salesforce.com spent $866 million on its infrastructure, up 34% from in the year-earlier period. Its Cloud subscription revenues also jumped 34% during the same period suggesting that the cost control effects may not fully materialize for another year or two.
Because of its global expansion and the pre-existing arrangements between hosting service providers and companies that have been acquired by Salesforce.com, the vendor now relies on such hosting partners as NTT Communications, Equinix, Interxion, in addition to its own data centers.
In the meantime, it’s likely that Salesforce.com will continue to incur incremental infrastructure expenses after making a series of acquisitions. Prior to its acquisition by Salesforce.com in June 2013, ExactTarget had signed contracts with hosting providers that would entail a total payment of $22 million through 2018 and beyond. In 2014 the payment obligation topped $4.5 million. While that may not sound much for a vendor that spent $866 million on infrastructure costs in the trailing four quarters, it’s obvious whatever costs that it incurs from its acquisitions will have to be mitigated against its expected revenue gain in order to sustain Salesforce.com’s relatively high margin of 79%.
Another mitigating factor lies in its platform customers. Veeva, for example, has ridden on the coattails of Salesforce.com by leveraging its platform and CRM functionality for the life sciences vertical. In return, Veeva is expected to pay at least $500 million through 2025 for using Salesforce.com’s infrastructure and data center operations for portions of its product portfolio.
While Salesforce.com’s infrastructure cost component is one of the key performance indicators in the Cloud applications marketplace because of its size, a number of other vendors are also worth watching because of their ability to influence the entire market segment.
Ellie Mae, Medidata, RealPage Among Other Big Spenders
Ellie Mae in online mortgage, Medidata Solutions in life science and RealPage in real estate have become the new symbols in selling industry-specific applications in the Cloud. All three have secured more than 100,000 subscribers each over the past 10 years after attracting some of the biggest companies within these verticals. Because of the mission critical nature of their applications, the infrastructure costs of these three vendors have also skyrocketed.
RealPage, which spends about $1,440 in infrastructure cost per subscriber annually, touts its RealPage Cloud consisting of more than 5,217 virtual servers, 413 physical servers and approximately 2.3 petabytes of data. Many of its 100,000 subscribers are real-estate property managers or lease agents who may deal online with hundreds or thousands of applicants and tenants concurrently at a given time.
Another KPI that RealPage likes to measure its performance against is the number of rentals – now totaling 9.5 million units – being connected with its applications. Using that metric to determine per rental unit per year would result in $15, rather than the whopping $1,440 in infrastructure cost on a per subscriber per year basis.
Both Ellie Mae and Medidata spent between $33 million and $35 million last year to support an estimated 100,000 subscribers each, averaging somewhere between $284 and $350 per subscriber annually. However the former has indicated that it would spend considerably more on beefing up its infrastructure following an outage that knocked down its Cloud service on March 31, 2014, disrupting the closing of the loans that its applications managed.
Additional investments in its data center infrastructure for Ellie Mae now resulted in $13 million to $16 million in capital expenditures for 2014. At the lower end of spending estimate, Ellie Mae could see its cost of revenues jump 36% to $45 million in 2014 from $33 million a year ago. For the nine-month period ended September 30, Ellie Mae’s revenues only rose 17% to $115 million.
If Ellie Mae plans to spend a lot more on its infrastructure, its margins are likely to take a hit. In 2013 Ellie Mae received about $1,500 from each of its SaaS users, while spending about $284 on infrastructure cost to support each of them. That amounted to 19 cents in cost for every dollar earned.
By comparison, Salesforce.com received about $1,020 last year from each of its estimated four million subscribers after spending about $178 in infrastructure cost to support each, or about 17 cents in cost for every dollar earned.
On the other end of the cost equation are Cloud applications vendors that have been able to squeeze maximum efficiency out of their infrastructure costs as they succeed in spreading them over millions of subscribers.
Kronos’ Cloud Budget
Kronos, which offers workforce management applications, now budgets about $5 million in infrastructure cost to support every one million subscribers, users typically log onto the Kronos Cloud a few times a day often at predictable intervals.
In other words, some vendors like Kronos are able to harness the ubiquity of the Cloud by making their systems readily accessible when usage demand can be anticipated or even planned well in advance.
Rubicon Project, for example, now sees its online advertising engine attracting as much as 2.5 million peak queries per second. Despite such heavy utilization, Rubicon manages to keep its infrastructure cost to about $15 million, or about $6 per subscriber per year for its 2.5 million subscribers.
Because infrastructure cost varies widely among Cloud applications vendors, the pressure to economize one’s spending will increase as competition heats up.
Another metric that’s worth mentioning is that regardless of how little one spends on infrastructure cost, few Cloud applications vendors have been able to post consistent profitability because of their lavish sales and marketing expenses.
One thing is certain. The health of a Cloud application vendor could be determined by how it contains and ultimately optimizes its infrastructure cost – similar to the painstaking steps logistic service providers would take in order to ensure they run the tightest ship in the shipping business.
That’s a must for any business, but perhaps a task that requires a lot more planning and investing in the Cloud applications market because of its ability to attract a vast amount of subscribers in a short period of time.
However it’s a different matter altogether for vendors needing to master the infrastructure cost component as they struggle to support customers adequately with a scalable Cloud infrastructure at the lowest cost possible.
Subscribe to Apps Run The Cloud and access premium content including a series of reports that analyze Cloud Cost Centers of the Cloud Top 500 applications vendors and their implications. The reports also include downloadable tables that detail the annual infrastructure spend among 61 of the Cloud Top 500 applications vendors as well as a full listing of hundreds of infrastructure service providers mostly cited by the Cloud Top 500 applications vendors as their primary and secondary hosting partners.
Research Methodology
Following the release of the Cloud Top 500 survey project in August 2014, we proceeded with further research on the Cloud infrastructure of the world’s 500 largest Cloud applications vendors. We supplement those data with interviews that we conducted with privately-held and publicly-traded companies in order to establish their current infrastructure spend levels, investment plans, as well as the data center service providers that they work with closely. For the Cloud Cost Centers study, our benchmarking data are derived from tabulating their costs of Cloud revenues over the past seven quarters as well as the number of Cloud subscribers.
Vendor shares and market forecast results are based on a combination of existing databases as well as demand side and supply side research conducted throughout the year with validation from vendors, customers, channel partners and documentations such as earnings releases and 10Q and 10K filings, vertical industry studies, regional and country-level statistics from public and private institutions.
For more on our SCORES methodology, check here. Don’t forget to look up our Cloud Applications taxonomy as well as a searchable database of thousands of Cloud applications customers that have been taking advantage of the latest innovation from these vendors. For additional information on our methodology and taxonomy, check https://www.appsruntheworld.com/research.
