
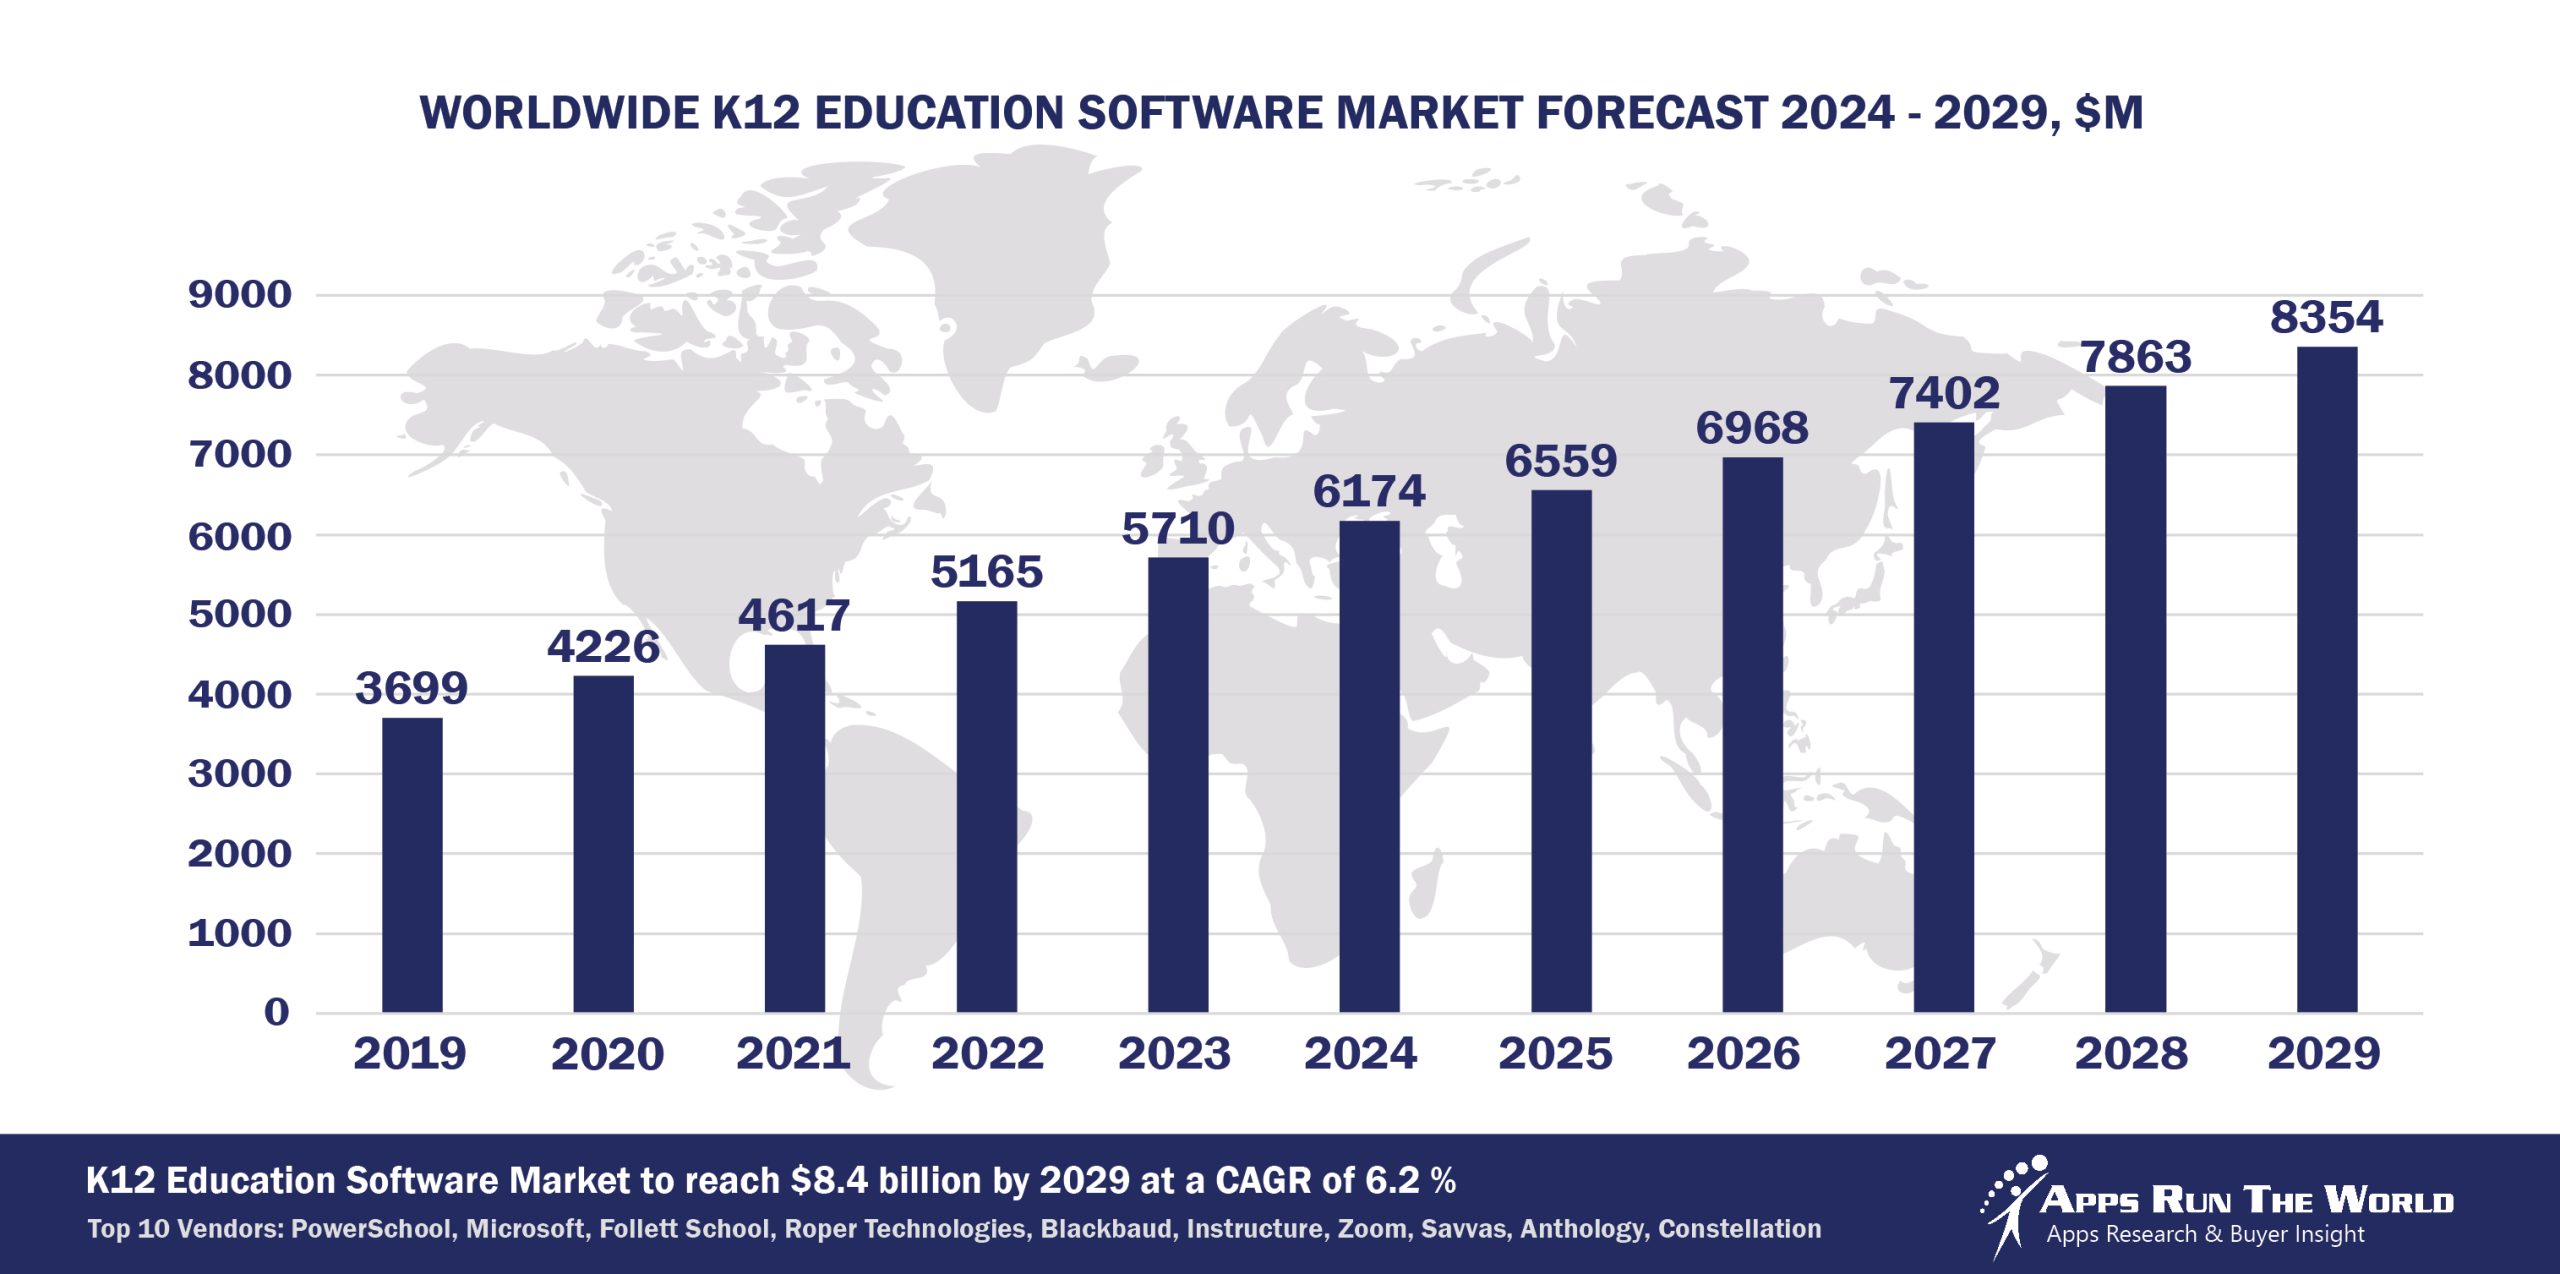
In 2024, the global K-12 Education software market grew to $6.2 billion, marking an 8.1% year-over-year increase. The top 10 vendors accounted for 42.3% of the total market. PowerSchool Group led the pack with a 10% market share, followed by Microsoft, Follett School Solutions, and Roper Technologies.
Through our forecast period, the K-12 applications market size is expected to reach $8.4 billion by 2029, compared with $6.2 billion in 2024 at a CAGR of 6.2%, as shown in the Apps Top 500 Report – Excel Edition [Preview] .
K12 (K-12 schools, technical and vocational, distance learning) – Student Information System, Enrollment Management System, Learning Management, Fund Accounting System, K12 Administration, Financials, HR, Procurement
Large-scale projects to implement new student information systems continue unabated as the global K12 market embraces the convergence of mobile learning, international testing standards as well as online instructions.
Top 10 K-12 Software Vendors in 2024 and their Market Shares
Source: Apps Run The World, July 2025
Other K12 software providers included in the report are ACI Worldwide, Inc., Adobe, Ansys Inc., Articulate, Autodesk, Axway, Capita Software, Community Brands, Cisco Systems, Civica, Constellation Software Inc., Cvent, Dominknow, Dropbox, Desire2Learn, Edmentum, ESM Solutions Corporation, Espressive, FIS Global, Genesys Telecommunications Laboratories, Google, Huron, IBM, Infinite Campus, Infor, Intuit Inc., Imagine Learning, Ivanti, Jenzabar, Kahoot, Laserfiche, LivePerson Inc., LearningMate, Nelnet, Inc., Open Text Corporation, PowerSchool Group LLC, Roper Technologies, Inc., Sage, SAP, Savvas Learning Co (formerly Pearson K12 Learning), Salesforce, SAS Institute, Selerix Systems, Inc, ServiceNow, Shiftboard, Skyward, Smartsheet, Squiz, TalentCircles, TechnologyOne, TalentMap, TeamDynamix, TMA Systems, Tyler Technologies, UNIT4, UKG, Zoom Video Communications, Zendesk, and others.
Vendor Snapshot: K-12 Market Leaders
 PowerSchool Group LLC
PowerSchool is embedding agentic AI across its administrative and instructional suite to drive adaptive learning, real-time operational insight, and predictive student engagement. Its roadmap emphasizes end-to-end automation, connecting SIS, finance, and talent workflows through intelligent agents that detect anomalies, recommend interventions, and automate compliance reporting. By integrating low-code AI modeling and conversational analytics, PowerSchool is empowering districts to build autonomous processes for enrollment forecasting, funding optimization, and risk identification. Recent acquisitions in data intelligence have deepened its ability to unify disparate school systems under a single agentic framework, shifting the K–12 model from reactive administration to predictive, student-centered governance.
Microsoft
Microsoft is reshaping K–12 digital learning ecosystems by embedding agentic intelligence across productivity, security, and data environments. AI copilots in Teams and Power Platform are enabling teachers, IT admins, and district leaders to create intelligent workflows that automate grading, synthesize student performance, or manage device fleets. Through Azure OpenAI and Education Data Lake integrations, districts can deploy autonomous agents that trigger interventions, flag social-emotional concerns, or optimize resource allocation based on contextual signals. Microsoft’s commitment to low-code governance, privacy-compliant copilots, and multilingual conversational agents positions it as a foundational platform for AI-enhanced learning operations in K–12.
Follett School Solutions
Follett is evolving from resource and content management to intelligent ecosystem orchestration, embedding autonomous agents that optimize library circulation, digital resource usage, and instructional alignment. Its Aspen SIS platform is increasingly leveraging agentic capabilities to surface academic risks, automate scheduling conflicts, and recommend curricular interventions. Through AI-driven catalog enrichment and usage analytics, Follett is enabling district leaders to deploy low-code agents that improve asset utilization and equity in access.
Roper Technologies
Frontline Education, under Roper Technologies, is driving intelligent automation across human capital, finance, and compliance workflows in K–12. Its platform now supports autonomous agents that preemptively flag teacher shortages, automate contract workflows, and simulate budget forecasts. Agentic AI is deeply integrated into leave tracking and workforce analytics, allowing HR leaders to deploy no-code bots that optimize staffing across schools and support strategic hiring. Recent investments focus on unifying ERP, timekeeping, and service management through cross-domain agents that streamline district operations while complying with local education mandates.
Blackbaud
Blackbaud is embedding agentic intelligence into its end-to-end engagement and financial solutions for private and independent K–12 schools. By fusing CRM, tuition, and advancement workflows, its AI agents help institutions model fundraising capacity, simulate tuition discounting strategies, and orchestrate alumni outreach with minimal staff input. Its intelligent automation roadmap is centered on deploying conversational agents that manage financial aid cycles, donor communications, and event coordination. Blackbaud’s extensible low-code platform supports the configuration of mission-specific agents that continuously learn from engagement signals, improving lifetime value tracking and institutional planning.
Instructure, Inc.
Instructure is rapidly advancing its Canvas ecosystem into an agentic learning platform where AI-driven copilots facilitate autonomous course adjustments, formative assessment scaffolding, and real-time feedback loops. Its analytics engine now supports autonomous agents that identify learning gaps, recommend differentiated content, and generate actionable insights for educators. With low-code agent configuration and real-time learning dashboards, districts can deploy tailored bots that align with state standards and personalized learning goals.
Zoom Video Communications
Zoom is transitioning from a video conferencing provider to an intelligent classroom collaboration hub, integrating agentic AI to power smart transcription, attendance tracking, and behavioral cues analysis. Its generative copilots now assist teachers with lesson summarization, question generation, and breakout room orchestration, all through natural language prompts. Zoom’s education roadmap includes autonomous moderation tools, multilingual assistants, and classroom interaction analytics that provide continuous feedback loops to educators. With expanding support for low-code extensions, Zoom enables IT and instructional teams to create custom agents that enhance accessibility, engagement, and digital classroom equity.
Savvas
Savvas is evolving its digital curriculum offerings with embedded AI agents that personalize instruction, automate formative assessment, and guide differentiated pacing. Its platform increasingly leverages autonomous learning engines that adapt lesson paths based on real-time student interactions and skill mastery. Recent AI upgrades enable teachers to deploy content-aligned assistants that recommend scaffolding strategies or alternate modalities on demand. Savvas is investing in agent-driven analytics that empower districts to visualize instructional efficacy across schools and adapt teaching practices through no-code dashboards, creating a feedback-rich, personalized K–12 learning experience.
Anthology (Blackboard, Campus Management, Campus Labs, and iModules)
Anthology is unifying its K–12 platforms under an AI-first vision that prioritizes autonomous learning guidance, equitable engagement, and institutional analytics. Its embedded agents monitor learner behavior across LMS, portals, and engagement systems to proactively recommend supports or content adjustments. Anthology’s conversational interfaces empower teachers and students to interact with curricula and support systems naturally, reducing friction in digital adoption. With a growing set of low-code automation tools, the company is enabling districts to create custom agents that bridge data silos, drive intervention workflows, and align with compliance metrics across fragmented K–12 environments.
Constellation Software
Constellation’s Harris division is embedding intelligent automation across its financial, HR, and SIS solutions to modernize K–12 back-office operations. Its agentic roadmap includes autonomous reconciliation, predictive budget modeling, and AI-powered personnel planning that adapt to enrollment shifts and state funding formulas. Harris platforms increasingly support conversational reporting interfaces, enabling district administrators to query financial and operational health without technical expertise. By emphasizing low-code integration frameworks and cross-system interoperability, Constellation is enabling districts to deploy self-learning agents that connect finance, HR, and instructional data into unified decision hubs.
ARTW Technographics Platform: K-12 customer wins
Since 2010, our research team has been studying the patterns of K-12 software purchases, analyzing customer behavior and vendor performance through continuous win/loss analysis. Updated quarterly, the ARTW Technographics Platform provides deep insights into thousands of K-12 customer wins and losses, helping users monitor competitive shifts, evaluate vendor momentum, and make informed go-to-market decisions.
List of K-12 customers
Source: ARTW Buyer Insights Technographic Database
Custom data cuts related to the K12 Applications market are available:
- Top 700+ K12 Applications Vendors and Market Forecast 2024-2029
- 2024 K12 Applications Market By Functional Market (16 Markets)
- 2024 K12 Applications Market By Country (USA + 45 countries)
- 2024 K12 Applications Market By Region (Americas, EMEA, APAC)
- 2024 K12 Applications Market By Revenue Type (License, Services, Hardware, Support and Maintenance, Cloud)
- 2024 K12 Applications Market By Customer Size (revenue, employee count, asset)
- 2024 K12 Applications Market By Channel (Direct vs Indirect)
- 2024 K12 Applications Market By Product
Worldwide Enterprise Applications by Vertical Market
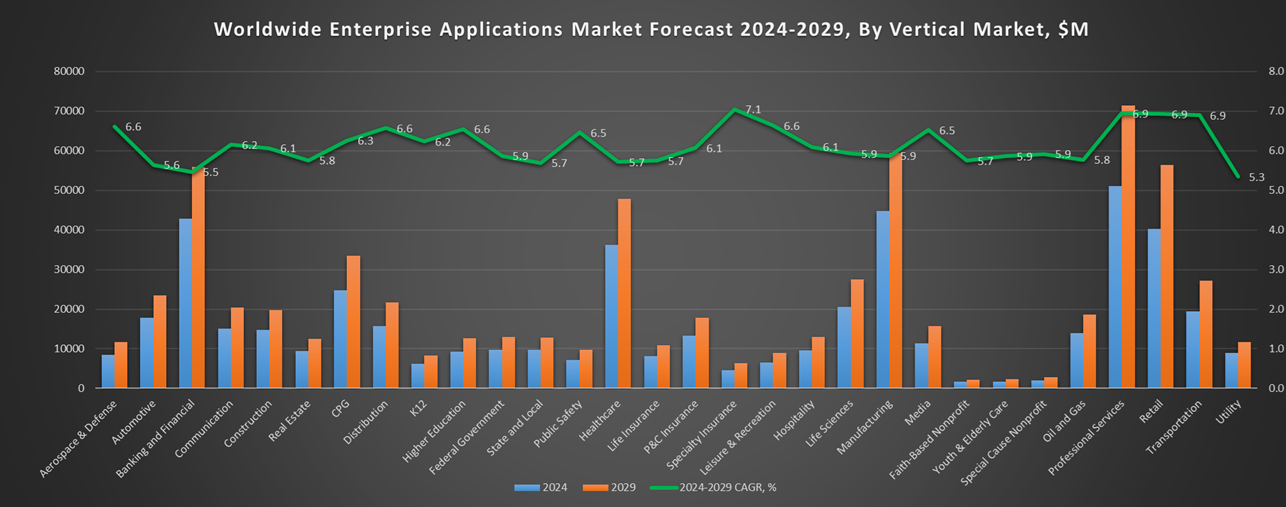
Exhibit 3 provides a forecast of the worldwide enterprise applications by vertical market from 2024 to 2029, highlighting market sizes, year-over-year growth, and compound annual growth rates across different industry sectors from Aerospace and Defense to Utilities.
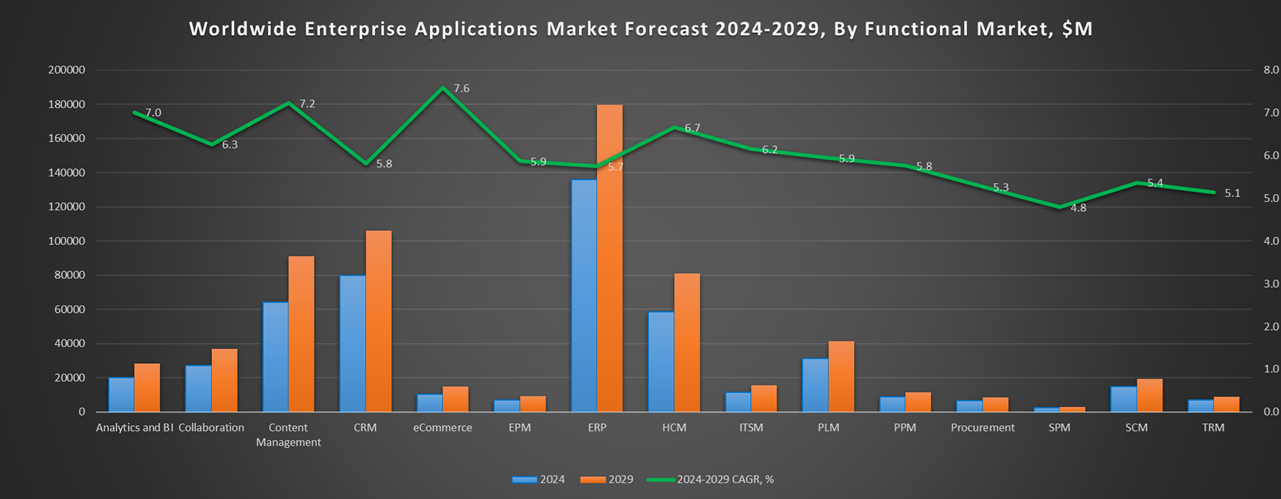
Exhibit 3: Worldwide Enterprise Applications by Vertical Market Forecast 2024-2029 by Functional Market ($M)
Source: Apps Run The World, July 2025
Exhibit 4 shows our projections for the enterprise applications market by vertical segment, based on the buying preferences and the customer propensity to invest in new software within those industries as they continue to upgrade and replace many legacy industry-specific applications that have been identified and tracked in our Buyer Insight Database.
FAQ – APPS RUN THE WORLD Top 10 K-12 Software Vendors, Market Size & Forecast
Q1. What is the global K-12 Education software market size in 2024?
A: The global K-12 Education software market grew to $6.2 billion in 2024, marking an 8.1% year-over-year increase.
Q2. Who are the top 10 K-12 Education software vendors in 2024 and their combined share?
A: The top 10 vendors are PowerSchool Group, Microsoft, Follett School Solutions, Roper Technologies, Anthology, Savvas Learning Company, Instructure, Blackboard, Schoology, and Infinite Campus, together accounting for 42.3% of the global K-12 Education software market.
Q3. Which vendor leads the K-12 Education software market in 2024?
A: PowerSchool Group leads the K-12 Education software market in 2024 with a 10% market share.
Q4. What is the forecast for the K-12 Education software market through 2029?
A: The market is projected to reach $8.4 billion by 2029, growing at a compound annual growth rate (CAGR) of 6.2%.
Q5. What applications are included in the scope of the K-12 Education software market?
A: The scope includes Student Information Systems (SIS), Learning Management Systems (LMS), Enrollment Management Systems, Fund Accounting Systems, K-12 Administration, Financials, HR, and Procurement.
Q6. Which other K-12 Education software vendors are covered beyond the top 10?
A: The report also profiles vendors such as Infinite Campus, Schoology, and Anthology, among others, offering specialized solutions for K-12 education.
Q7. When was this K-12 Education software report published, and by whom?
A: The Top 10 K-12 Education Software Vendors, Market Size & Forecast 2024–2029 report was published in July 2025 by APPS RUN THE WORLD analysts Albert Pang, Misho Markovski, and Aleksandra Markovska, as part of the APPS TOP 500 research program, which benchmarks the revenues and market share of the world’s 1,500+ largest enterprise application vendors.
More Enterprise Applications Research Findings
Based on the latest annual survey of 10,000+ enterprise software vendors, Apps Run The World is releasing a number of dedicated reports, which profile the world’s 1,500 largest Enterprise Applications Vendors ranked by their 2024 product revenues. Their 2024 results are being broken down, sorted, and ranked across 16 functional areas (from Analytics and BI to Treasury and Risk Management) and by 21 vertical industries (from Aerospace to Utility), as shown in our Taxonomy. Further breakdowns by subvertical, country, company size, etc. are available as custom data cuts per special request.
Research Methodology
Each year, our global team of researchers conducts an annual survey of thousands of enterprise software vendors by contacting them directly on their latest quarterly and annual revenues by country, functional area, and vertical market.
We supplement their written responses with our own primary research to determine quarterly and yearly growth rates, in addition to customer wins, to ascertain whether these are net new purchases or expansions of existing implementations.
Another dimension of our proactive research process is through continuous improvement of our customer database, which stores more than one million records on the enterprise software landscape of over 2 million organizations around the world.
The database provides customer insight and contextual information on what types of enterprise software systems and other relevant technologies they are running and their propensity to invest further with their current or new suppliers as part of their overall IT transformation projects to stay competitive, fend off threats from disruptive forces, or comply with internal mandates to improve overall enterprise efficiency.
The result is a combination of supply-side data and demand-generation customer insight that allows our clients to better position themselves in anticipation of the next wave that will reshape the enterprise software marketplace for years to come.
- Audio Enhancement, a United States based Retail organization with 10 Employees
- Yantai XiErde New Material Co., a China based Manufacturing company with 10 Employees
- Zoho, a India based Professional Services organization with 19000 Employees
| Logo | Company | Industry | Employees | Revenue | Country | Evaluated |
|---|
