
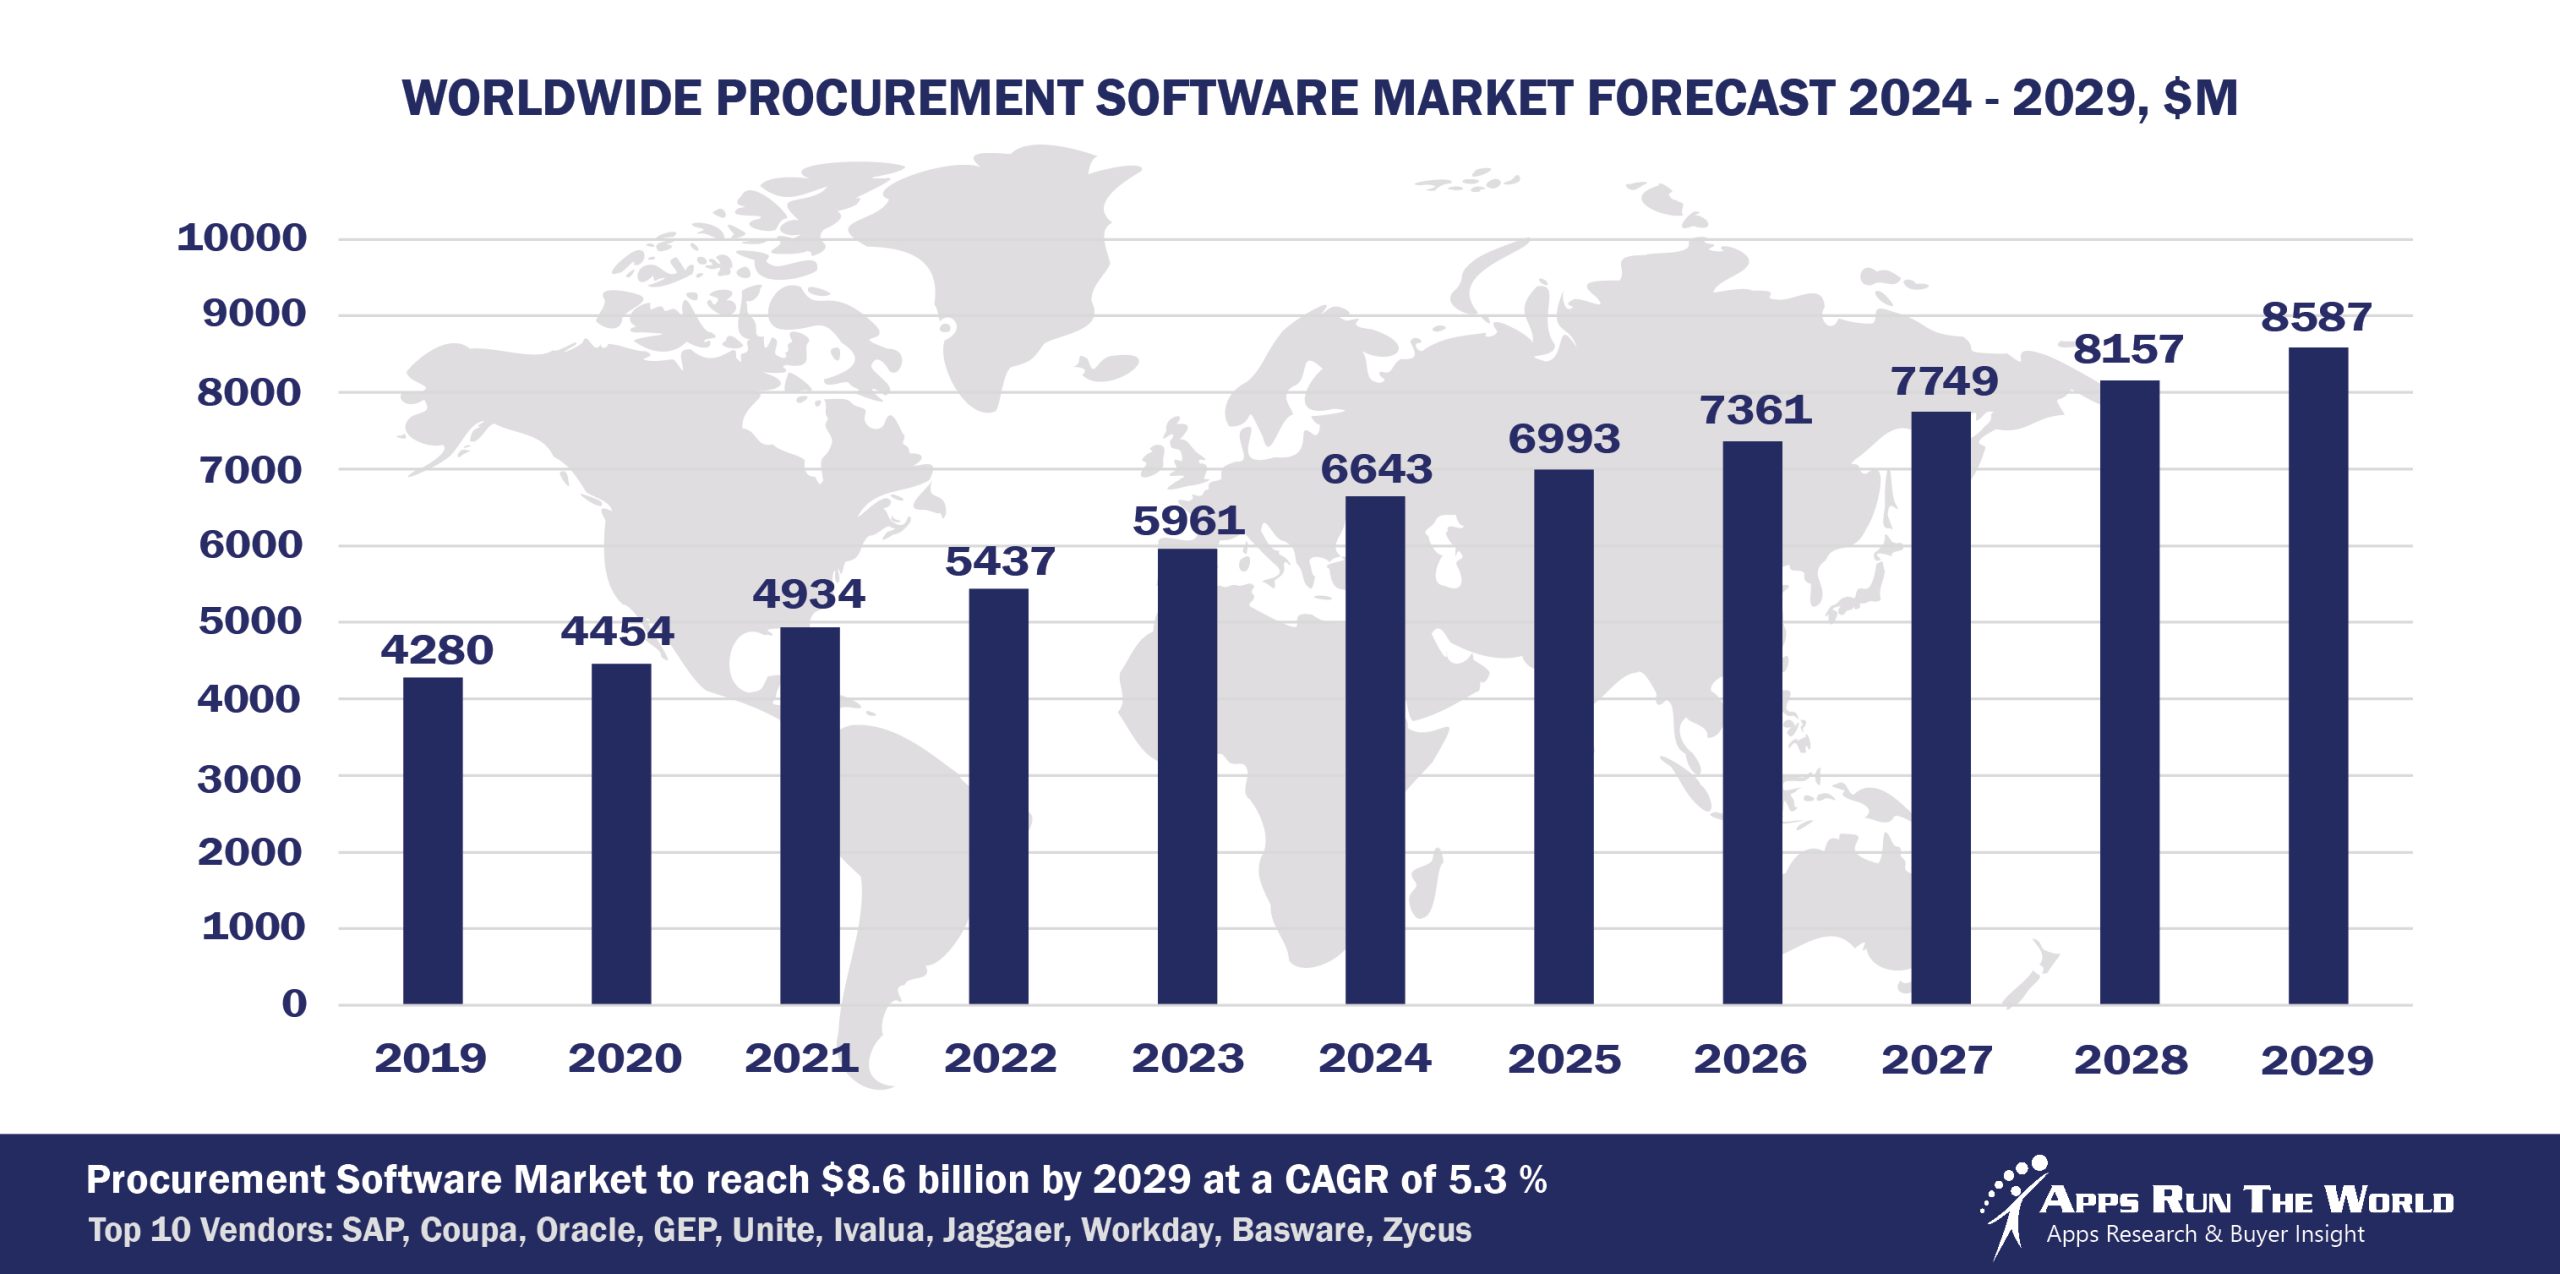
In 2024, the global Procurement software market grew to $6.6 billion, marking an 11.4% year-over-year increase. The top 10 vendors accounted for 59% of the total market, with SAP leading at 29.1%, followed by Coupa Software, Oracle, and GEP.
Through our forecast period, the Procurement applications market size is expected to reach $8.6 billion by 2029, compared with $6.6 billion in 2024 at a CAGR of 5.3%, as shown in the Apps Top 500 Report – Excel Edition [Preview] .
Procurement covers applications designed for purchasing material (whether direct or indirect; raw, in process, or finished; as a result of or flowing into a product supply chain-specific business process; or in support of performing a service) and services (business or professional).
Other functions include contract management, electronic network, punch-out, sourcing, and supplier rating to optimize the overall supplier relationship management business processes. Procurement applications revenues represent a major contributor to the Enterprise Resource Planning market as part of our market sizing exercise.
Supplier discovery and relationship management, coupled with a networked marketplace, boost procurement activities.
Top 10 Procurement Software Vendors in 2024 and their Market Shares
Source: Apps Run The World, July 2025
Other procurement software providers included in the report are: abas Business Software, Access Group, Achilles, Advanced, American Software, Aptos, Asseco Group, Beeline, BirchStreet Systems, CDK Global, Cegid, Comarch SoftM, Constellation Software Inc., Corcentric, Duzon Digitalware, E2open, Ellucian, Epicor, ESM Solutions Corporation, Exact Holding BV, Exela Technologies, Inc., Fourth Ltd, FuturMaster, Inetum (ex GFI Informatique), GHX, IBS Software Services, icertis, IFS, Ignite Technologies, Blue Yonder, MercuryGate International, OBIC Co. Ltd., Open Text Corporation, Openbravo, PRGX Global Inc., PRO Unlimited, PROACTIS Group, Procore, Pronto Software, QAD, Ramco Systems, River Logic, Inc., Roper Technologies, Inc., Sage, Scanmarket, ServiceNow, Sênior Sistemas, SmartERP, SupplyOn, Taulia, Tigernix Pte Ltd, Tungsten, TotalSoft, Tradeshift, UNIT4, Visma, Vormittag Associates Inc., VORTAL Connecting Business, Vroozi, Yonyou, Zycus, and others.
Vendor Snapshot: Procurement Market Leaders
 SAP
SAP
SAP is aggressively positioning its procurement capabilities at the center of a production-grade agent network, connected via its new AI Foundation and Joule agents. At SAP Sapphire 2025, it unveiled autonomous agents that not only assist but execute workflows across sourcing, contracting, invoicing, and supplier onboarding. Procurement-specific agents, including the sourcing agent beta and generative document summarizers, reduce cycle time while enabling advanced reasoning through SAP’s Knowledge Graph and NVIDIA/Mistral-powered LLMs. With Joule Studio’s low-code tools expected GA in Q4 2025, SAP is betting big on composable, no-code procurement agents embedded into Ariba and S/4HANA Procurement workflows.
Coupa Software
Coupa’s multi-agent AI architecture, Navi, launched in early 2025, ushers in an era of autonomous spend management powered by $8 trillion in anonymized community spend data. Navi agents autonomously initiate sourcing events, evaluate vendor risk, simulate costing strategies, and enforce policies—all through natural-language interfaces embedded across the Coupa ecosystem. The platform’s no-code configuration tools allow procurement teams to define agent roles and workflow behaviors visually. Coupa’s mission: autonomous procurement decision-making with minimal human intervention.
Oracle
Oracle has infused agentic intelligence across its Fusion Cloud Procurement stack, rolling out purpose-built assistants like Policy Advisor and PO Summary Agent that guide users through complex decisions with contextual cues. These agents automate supplier onboarding, risk flagging, and purchasing compliance. Oracle’s AI Agent Studio—anchored in OCI, LangChain, and RAG—gives customers tools to orchestrate their own procurement agents across Fusion, NetSuite, and sourcing modules. The emphasis is on full-cycle, horizontal interoperability of agent behaviors across ERP, SCM, and finance.
GEP
GEP’s SMART platform is evolving into a domain-specific autonomous procurement engine, where embedded agents simulate sourcing scenarios, recommend supplier matches, and negotiate contracts in real time. Cognitive agents are composable through a visual orchestration layer, enabling procurement leaders to define triggers, roles, and escalation logic. GEP continues to lead in specialized vertical intelligence, merging AI reasoning with human oversight across its Procure-to-Pay ecosystem.
Unite (Formerly Mercateo)
Unite is advancing its procurement marketplace into an autonomous intelligence hub, where embedded agents dynamically adjust catalog governance, supplier eligibility, and price benchmarking based on buyer profile, compliance rules, and spending patterns. These agents autonomously trigger supplier onboarding, eligibility validation, and negotiated pricing offers in real time. The platform supports API-first integration, allowing agentic logic to flow across external ERP systems and distributed procurement networks with minimal coding, positioning Unite as a procurement intelligence layer for decentralized ecosystems.
Ivalua
Ivalua’s V10 platform marks a shift to agentic procurement, powered by a multi‑agent architecture delivered via its intelligent assistant, IVA, capable of end‑to‑end sourcing, contract, and risk tasks. IVA now autonomously evaluates requests, drafts contracts, and advises on risk exposure, all within a no‑code, low-code framework that enables procurement teams to design workflows without developers. The 2025 roadmap reveals integrations with Office tools for real-time document generation and contextual agent guidance, pointing toward a future of fully embedded, voice-activated procurement operations.
Jaggaer
Jaggaer ONE is being rearchitected as a composable agentic platform where sourcing, scoring, and negotiation logic are defined via scripted prompts and conversational UI. New predictive agents model optimal sourcing pathways, flag SLA risk, and guide supplier decisions in real time. Jaggaer’s vision minimizes human intervention, positioning its platform as a cockpit for exception-led procurement oversight.
Workday
Workday is embedding procurement agents across its unified data model, enabling context-aware assistance that spans requisition creation, supplier diversity evaluation, and contract compliance. These agents leverage cross-domain insights from HR and finance to enforce smarter procurement governance. Workday’s roadmap integrates low-code controls for tailoring agent behaviors—underscoring its strategy of procurement as a seamless extension of its AI-native enterprise stack.
Basware
Basware is embedding agentic AI across its AP automation and procurement stack, led by InvoiceAI and new AP Business/Data Agents that deliver real-time invoice summarization, anomaly detection, and natural-language data queries. These agents automate compliance, fraud detection, and supplier onboarding while surfacing strategic insights from transactional flows. With generative AI-driven compliance tools slated for 2025, Basware is positioning its platform as an autonomous, self-learning AP and procurement intelligence layer that minimizes manual intervention and accelerates decision cycles.
Zycus
Zycus is building a federated agentic framework across its procurement suite, with generative agents that summarize dashboards, draft compliance clauses, and initiate approval flows based on dynamic thresholds. Its modular AI architecture enables agents to collaborate across workflows—from sourcing to payment—through microservices orchestration. Zycus is leaning into embedded, continuously learning agents as the foundation of intelligent procurement transformation.
ARTW Technographics Platform: Procurement customer wins
Since 2010, our research team has been studying the patterns of the Procurement software purchases, analyzing customer behavior and vendor performance through continuous win/loss analysis. Updated quarterly, the ARTW Technographics Platform provides deep insights into thousands of Procurement customer wins and losses, helping users monitor competitive shifts, evaluate vendor momentum, and make informed go-to-market decisions.
List of Procurement customers
Source: ARTW Buyer Insights Technographic Database
Custom data cuts related to the Procurement Applications market are available:
- Top 170+ Procurement Applications Vendors and Market Forecast 2024-2029
- 2024 Procurement Applications Market By Industry (21 Verticals)
- 2024 Procurement Applications Market By Procurement Segments and Categories
- 2024 Procurement Applications Market By Country (USA + 45 countries)
- 2024 Procurement Applications Market By Region (Americas, EMEA, APAC)
- 2024 Procurement Applications Market By Revenue Type (License, Services, Hardware, Support and Maintenance, Cloud)
- 2024 Procurement Applications Market By Customer Size (revenue, employee count, asset)
- 2024 Procurement Applications Market By Channel (Direct vs Indirect)
- 2024 Procurement Applications Market By Product
Worldwide Enterprise Application Market
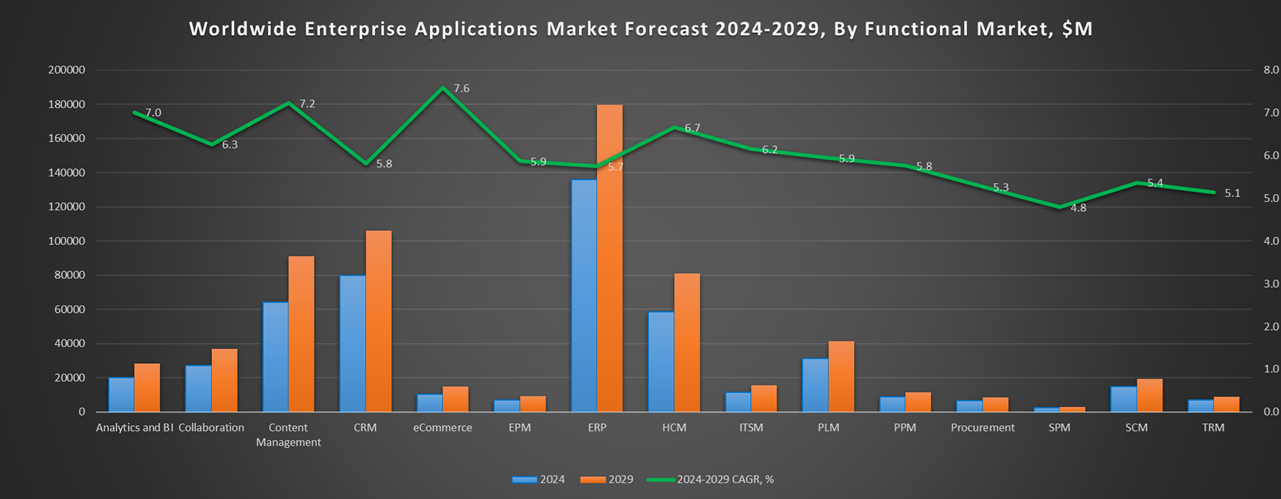
Exhibit 3 provides a forecast of the worldwide enterprise application market from 2024 to 2029, highlighting market sizes, year-over-year growth, and compound annual growth rates across various functional segments. The data shows strong growth in emerging areas like Content Management, eCommerce, Human Capital Management, and IT Service Management, while traditional segments like ERP and CRM continue to dominate in market size.
Exhibit 3: Worldwide Enterprise Application Market Forecast 2024-2029 by Functional Market, $M
Source: Apps Run The World, July 2025
Exhibit 4 shows the enterprise applications market by functional area. The highest growth functional markets revolve around smaller segments like Analytics and BI, eCommerce, Enterprise Performance Management, where first movers remain less established than those that for decades have been entrenched in functional areas like ERP, HCM, CRM and PLM.
FAQ – APPS RUN THE WORLD Top 10 Procurement Software Vendors, Market Size & Forecast
Q1. What is the global Procurement software market size in 2024?
A: The global Procurement software market reached $6.6 billion in 2024, growing 11.4% year-over-year.
Q2. Who are the top 10 Procurement software vendors in 2024, and what share do they hold?
A: The top 10 vendors include SAP, Coupa Software, Oracle, GEP, Unite (Formerly Mercateo), Ivalua, Jaggaer, Workday, Basware, and Zycus, together holding 59% of the Procurement market.
Q3. Which vendor leads the Procurement software market in 2024?
A: SAP leads the market with about 29.1% market share.
Q4. What is the forecast for the Procurement software market through 2029?
A: The market is projected to grow to $8.6 billion by 2029, from $6.6 billion in 2024, at a 5.3% compound annual growth rate.
Q5. What functions are included under Procurement software in this report?
A: Includes purchasing of materials and services (direct and indirect), contract management, e-sourcing, supplier rating, electronic networks, punch-out, and supplier relationship management.
Q6. Which other Procurement software vendors are covered beyond the top 10?
A: The report also covers vendors such as Procurify, SynerTrade, Determine, and Tradeshift, among others.
Q7. When was this Procurement report published and by whom?
A: The Top 10 Procurement Software Vendors, Market Size & Forecast 2024–2029 report was published in July 2025 by APPS RUN THE WORLD analysts Albert Pang, Misho Markovski, and Marija Ristik, as part of the APPS TOP 500 research program, which benchmarks the revenues and market share of the world’s 1,500+ largest enterprise application vendors.
More Enterprise Applications Research Findings
Based on the latest annual survey of 10,000+ enterprise software vendors, Apps Run The World is releasing a number of dedicated reports, which profile the world’s 1,500 largest Enterprise Applications Vendors ranked by their 2024 product revenues. Their 2024 results are being broken down, sorted and ranked across 16 functional areas (from Analytics and BI to Treasury and Risk Management) and by 21 vertical industries (from Aerospace to Utility), as shown in our Taxonomy. Further breakdowns by subvertical, country, company size, etc. are available as custom data cuts per special request.
Research Methodology
Each year our global team of researchers conduct an annual survey of thousands of enterprise software vendors by contacting them directly on their latest quarterly and annual revenues by country, functional area, and vertical market.
We supplement their written responses with our own primary research to determine quarterly and yearly growth rates, In addition to customer wins to ascertain whether these are net new purchases or expansions of existing implementations.
Another dimension of our proactive research process is through continuous improvement of our customer database, which stores more than one million records on the enterprise software landscape of over 2 million organizations around the world.
The database provides customer insight and contextual information on what types of enterprise software systems and other relevant technologies are they running and their propensity to invest further with their current or new suppliers as part of their overall IT transformation projects to stay competitive, fend off threats from disruptive forces, or comply with internal mandates to improve overall enterprise efficiency.
The result is a combination of supply-side data and demand-generation customer insight that allows our clients to better position themselves in anticipation of the next wave that will reshape the enterprise software marketplace for years to come.
- Conversight, a United States based Professional Services organization with 50 Employees
- Growfin, a United States based Professional Services company with 50 Employees
- United Country Real Estate, a United States based Construction and Real Estate organization with 5000 Employees
| Logo | Company | Industry | Employees | Revenue | Country | Evaluated |
|---|
