
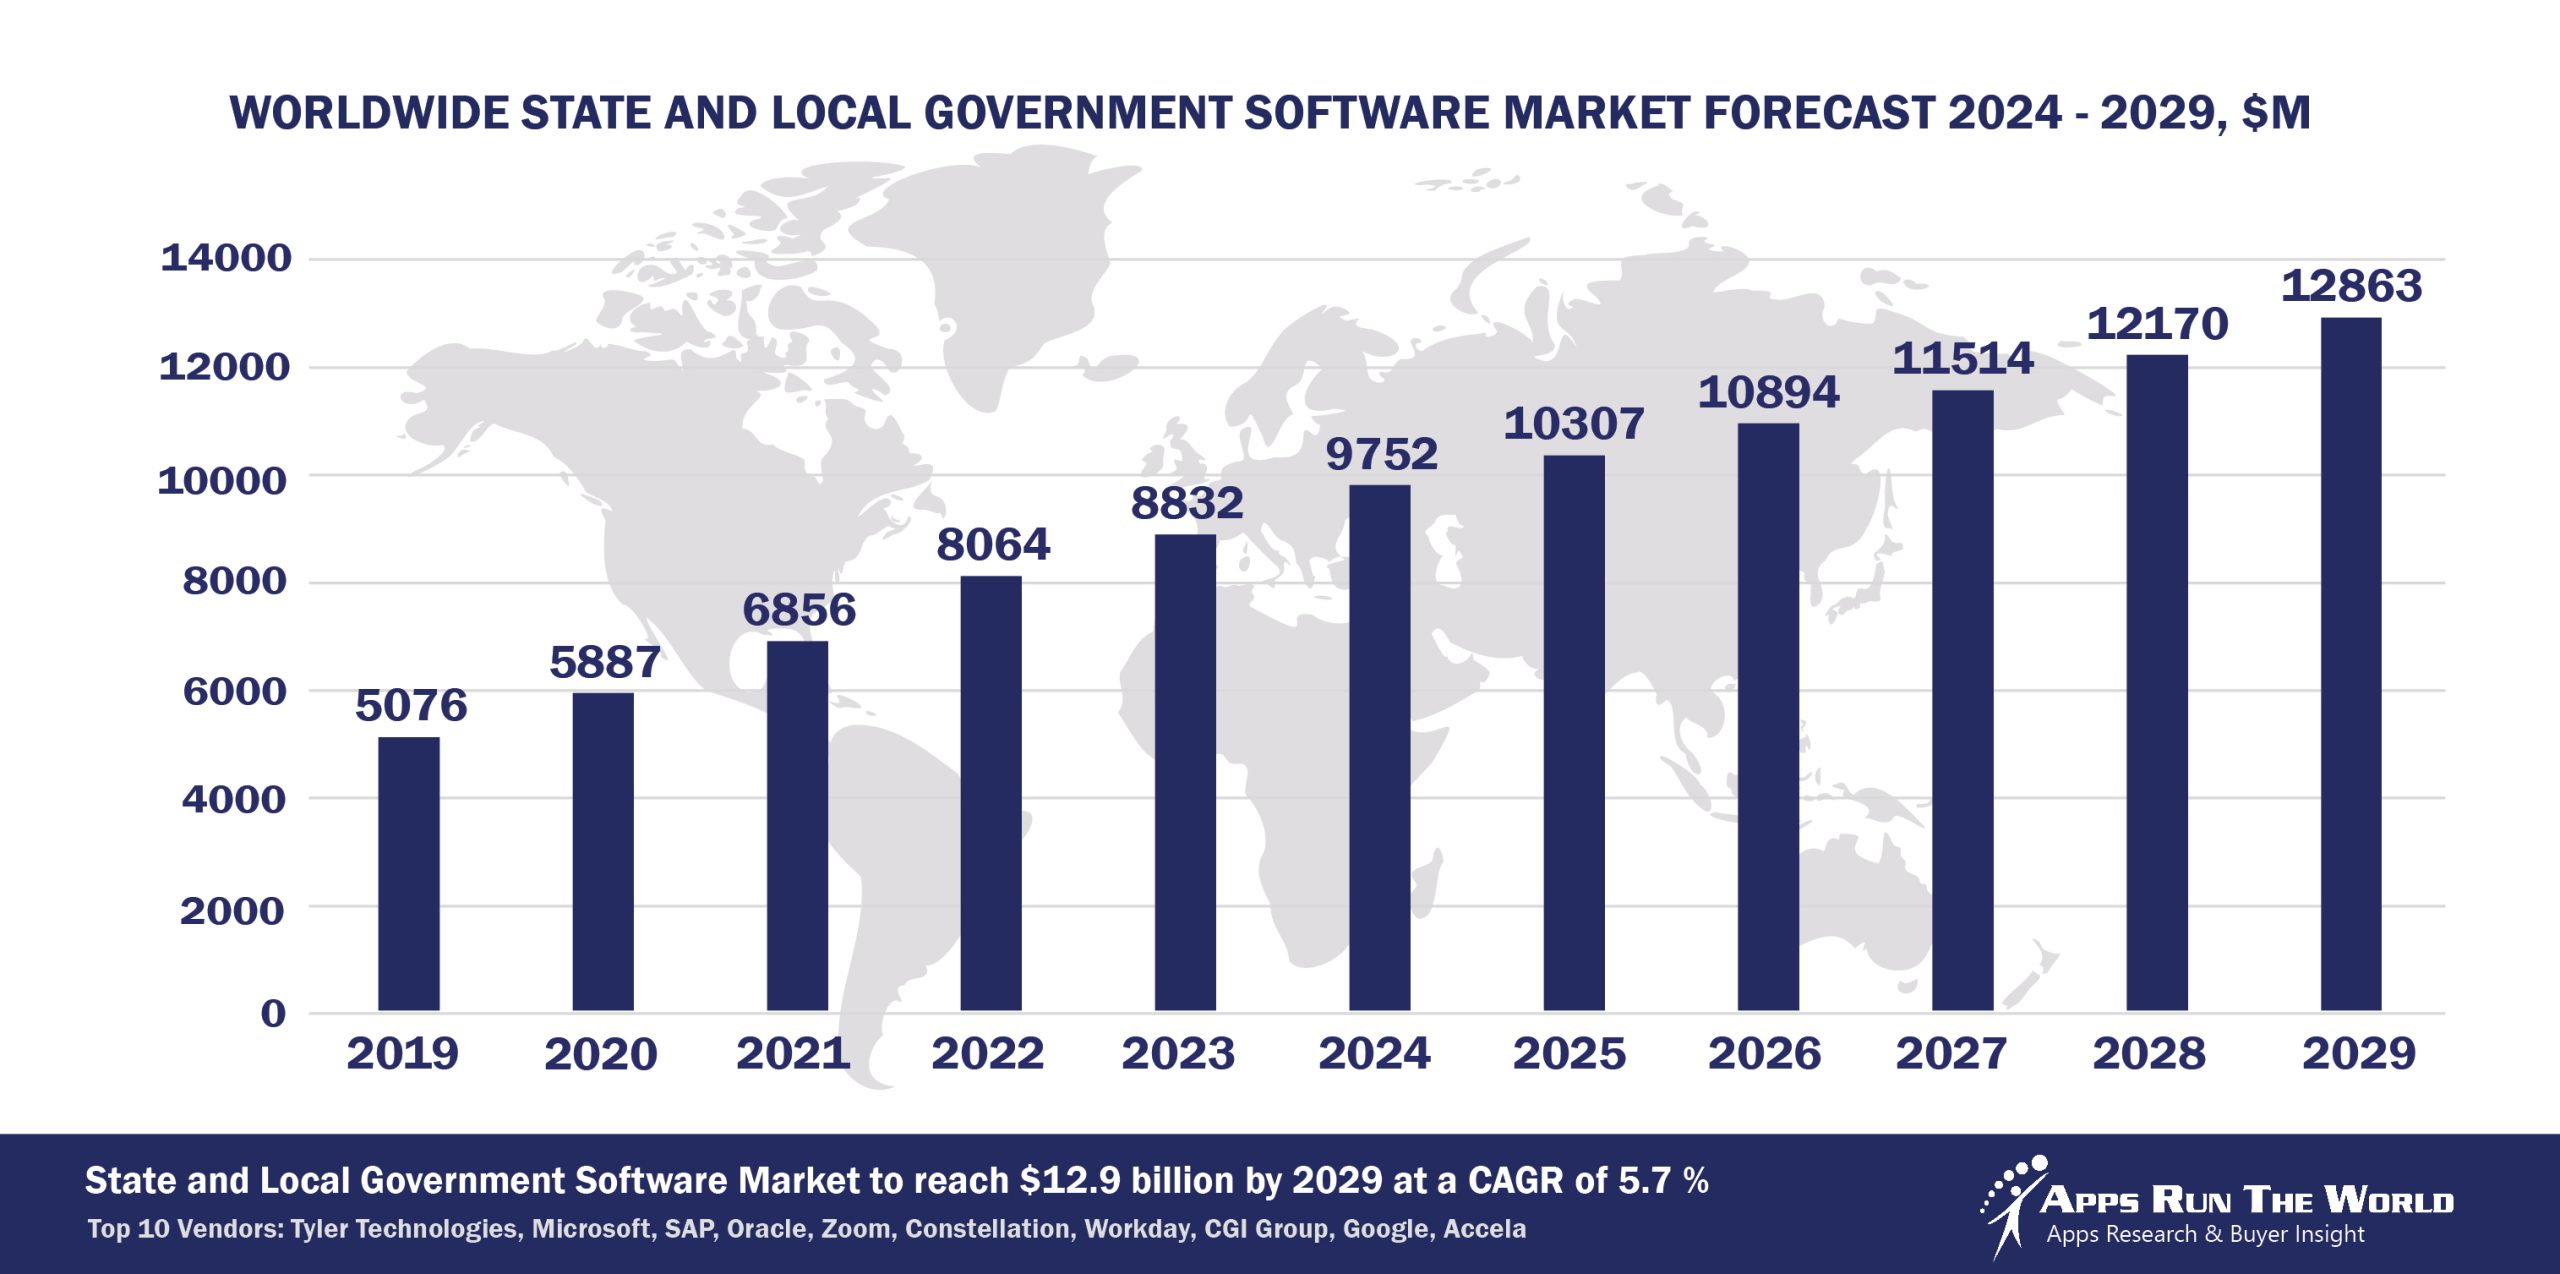
In 2024, the global State and Local Government software market grew to $9.7 billion, marking a 10.4% year-over-year increase. The top 10 vendors accounted for 45.1% of the total market. Tyler Technologies led the pack with an 11.2% market share, followed by Microsoft, SAP, and Oracle.
Through our forecast period, the State and Local Government applications market size is expected to reach $12.9 billion by 2029, compared with $9.8 billion in 2024 at a CAGR of 5.7%, as shown in the Apps Top 500 Report – Excel Edition [Preview] .
State and Local Government (state and local government agencies, nonprofit) Grants and performance management, Computer Assisted Dispatch, Jail Management, Courts Management, Tax Collections, Records Management, Financials, HR, Procurement
e-Government is the catalyst for new system purchases, especially among developing countries. Apps designed to improve tax revenue collection will continue to take precedence over other front-office systems.
Top 10 State and Local Government Software Vendors in 2024 and their Market Shares
Source: Apps Run The World, July 2025
Other State and Local Government software providers included in the report are Accela, ACI Worldwide, Inc., Avenu Insights & Analytics, Adobe, ADP, Advanced, Atos (Including Evidian), Asseco Group, Atlassian, Avue Technologies, Berger-Levrault, Blackbaud, Blackboard, Capita Software, Cegid, Celayix Software, CentralSquare Technologies, Dayforce, Cisco Systems, Citrix, Civica, CivicPlus, Computer Modeling Group, Dileoz, Dropbox, DocuSign, Inc., FIS Global, Fiserv, Google, GTY Technology Holdings Inc., Granicus, Hexagon, Hyland, Informatica, Intime Solutions, Ivanti, Intuit Inc., IBM, Infor, Journyx, Kofax, Laserfiche, Motorola Solutions, Nice Systems, Open Text Corporation, PROACTIS Group, Roper Technologies, Inc., Salesforce, Serviceaide, ServiceNow, Silverlake Axis, Squiz, SAS Institute, TCP Software, TeamDynamix, Teradata Corporation, TMA Systems, UNIT4, Visma, Verint Systems Inc., Vitech Systems Group, Wex, Workday, XCD HR Limited, and others.
Vendor Snapshot: State and Local Government Market Leaders
 Tyler Technologies
Tyler is strategically repositioning itself as a core AI orchestration layer for municipal operations, transforming ERP, court, and citizen service stacks into agent-driven engines. Recent AI-powered enhancements focus on enabling embedded agents for invoice validation, permit adjudication, and automated budget line-item analysis. These agents are being built directly into its ERP and judicial workflows, minimizing replatforming friction. Tyler is also investing in low-code AI agent builders tailored for finance and community development departments, offering municipalities conversational triage bots and autonomous form processors trained on localized policy.
Microsoft
Microsoft is embedding agentic capabilities across its productivity and compliance infrastructure to serve SLG needs with secure, integrated AI systems. Through Copilot and Power Platform convergence, government agencies can now spin up autonomous agents that analyze legislative documents, automate agenda creation, and summarize constituent requests, all using low-code workflows in Microsoft Teams or SharePoint. Microsoft’s AI ecosystem emphasizes trust, providing granular access control, identity-bound agents, and full audit logging, which are critical for state records governance. Microsoft’s strategy positions it as a default agent fabric for SLG, where each user, department, or policy becomes a node in a distributed, intelligent automation mesh, enabling scalable transformation without wholesale replacement.
SAP
SAP’s SLG transformation strategy centers on embedding autonomous agents within its Business Technology Platform and ERP fabric, creating a dynamic workflow ecosystem for budgeting, procurement, and workforce management. With recent innovations, SLG clients can now orchestrate compliance agents to validate spend requests, simulate public works budget outcomes, or generate predictive HR analytics. SAP’s go-to-market for SLG increasingly emphasizes composability, letting agencies use no-code agent templates to automate permitting, invoice validation, and policy review. By integrating conversational AI into planning and citizen-facing touchpoints, SAP is building toward an end-to-end, federated government platform powered by intelligent agents that operate across finance, procurement, and service domains.
Oracle
Oracle’s public sector strategy now actively embraces agentic AI as the backbone of its SLG modernization stack. Autonomous agents are being embedded across financials, human capital, and analytics modules, handling procurement flows, cross-jurisdictional compliance checks, and grant tracking tasks. Oracle’s agent studio tools enable low-code development of policy-bound AI agents, capable of ingesting real-time data and executing across a unified data fabric without manual coordination. Importantly, its conversational interface investments, especially in analytics and budget planning, allow state agencies to interact with complex datasets through natural language, driving faster decisions and better transparency.
Zoom Video Communications
Zoom is evolving beyond virtual meetings into a state and local platform with embedded agentic capabilities focused on citizen engagement and public hearings. With conversational AI now integrated across recordings and live streams, Zoom allows governments to automate closed-caption summaries, transcript tagging, and even auto-routing of constituent requests based on real-time sentiment or topic recognition. Zoom’s roadmap positions it as an intelligent, context-aware layer, where public records, digital hearings, and internal collaboration become searchable and actable via AI agents embedded in its core.
Constellation Software Inc.
Through its Harris Local Government division, Constellation has begun injecting agentic functionality into municipal ERP, utility billing, and permitting systems. By modularizing legacy solutions into microservices, Constellation is enabling embedded agents to handle tasks like delinquency forecasting, rules-based license issuance, and anomaly detection in public works budgets. It is also introducing conversational overlays that surface predictive insights directly within legacy UIs. Their strategy emphasizes retrofit-friendly AI: municipalities can incrementally layer automation agents onto existing Harris platforms via low-code agent builders, eliminating the need for disruptive migrations.
Workday
Workday’s approach to SLG modernization is rooted in embedding intelligent agents within HR, finance, and planning workflows. Its AI roadmap prioritizes agents that autonomously surface compensation anomalies, predict workforce attrition, and generate budget scenario narratives, capabilities especially critical for local agencies under fiscal pressure. The company’s recent investment in agentic augmentation of its analytics engine allows planners to pose natural language queries and receive agent-curated dashboards. Workday’s unified architecture supports a tightly integrated no-code agent creation environment, enabling departments to configure policy-specific bots without IT overhead.
CGI Group Inc.
CGI’s Advantage platform is increasingly acting as a policy-aligned agent layer across financial, grants, and workforce functions for state agencies. Through strategic upgrades, Advantage now supports AI agents that automate budget validation, generate audit-ready expenditure narratives, and simulate grant fund scenarios. CGI’s Transcend architecture is designed to allow multi-agent systems to collaborate across modules, like integrating compliance agents in workforce onboarding or fraud agents in procurement.
Google’s SLG strategy hinges on enabling data-centric agents that operate across communication (Workspace), analytics (Looker, BigQuery), and operational intelligence (Vertex AI) layers. With unified identity and data context, agencies can deploy lightweight autonomous agents that summarize internal documents, create agenda items, or monitor civic sentiment, all surfaced through secure Google Chat or Gmail environments. Google is heavily invested in democratizing AI in government through simple RAG workflows, letting non-technical staff generate budget insights or process automation using natural language.
Accela
Accela has rapidly expanded its AI vision through embedded automation across permitting, licensing, and regulatory workflows. With recent integrations like AI-based document classifiers and conversational agents for 311 request triage, it is now offering a public-sector–specific agent ecosystem. The platform now includes no-code configuration tools that allow departments to deploy task-specific bots, like inspection schedulers or code violation predictors, directly into live environments without developer intervention.
ARTW Technographics Platform: State and Local Government customer wins
Since 2010, our research team has been studying the patterns of State and Local Government software purchases, analyzing customer behavior and vendor performance through continuous win/loss analysis. Updated quarterly, the ARTW Technographics Platform provides deep insights into thousands of State and Local Government customer wins and losses, helping users monitor competitive shifts, evaluate vendor momentum, and make informed go-to-market decisions.
List of State and Local Government customers
Source: ARTW Buyer Insights Technographic Database
Custom data cuts related to the State and Local Government Applications market are available:
- Top 750+ State and Local Government Applications Vendors and Market Forecast 2024-2029
- 2024 State and Local Government Applications Market By Functional Market (16 Markets)
- 2024 State and Local Government Applications Market By Country (USA + 45 countries)
- 2024 State and Local Government Applications Market By Region (Americas, EMEA, APAC)
- 2024 State and Local Government Applications Market By Revenue Type (License, Services, Hardware, Support and Maintenance, Cloud)
- 2024 State and Local Government Applications Market By Customer Size (revenue, employee count, asset)
- 2024 State and Local Government Applications Market By Channel (Direct vs Indirect)
- 2024 State and Local Government Applications Market By Product
Worldwide Enterprise Applications by Vertical Market
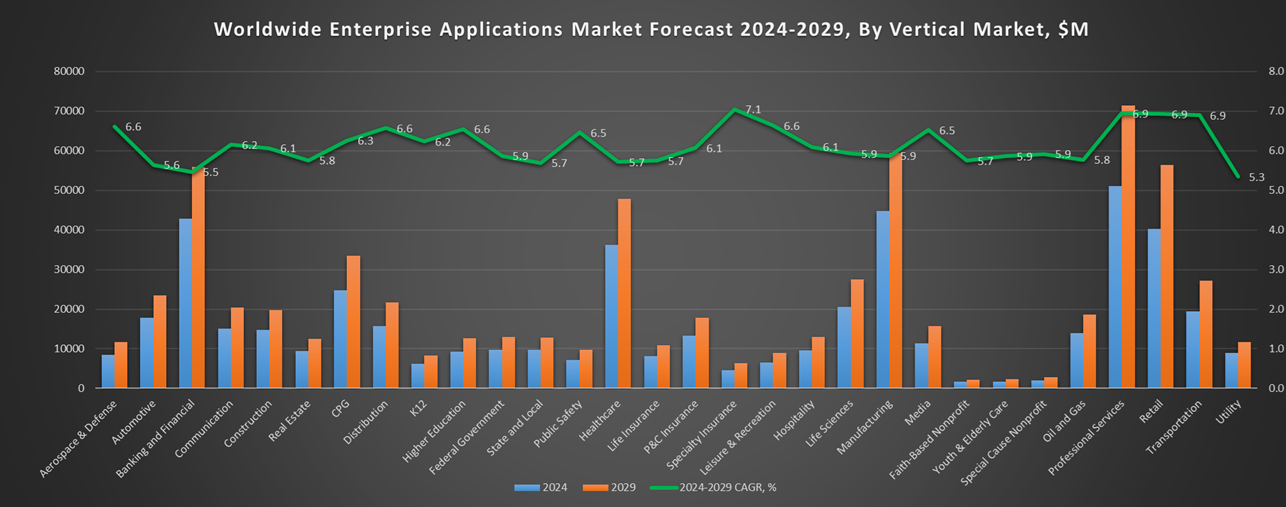
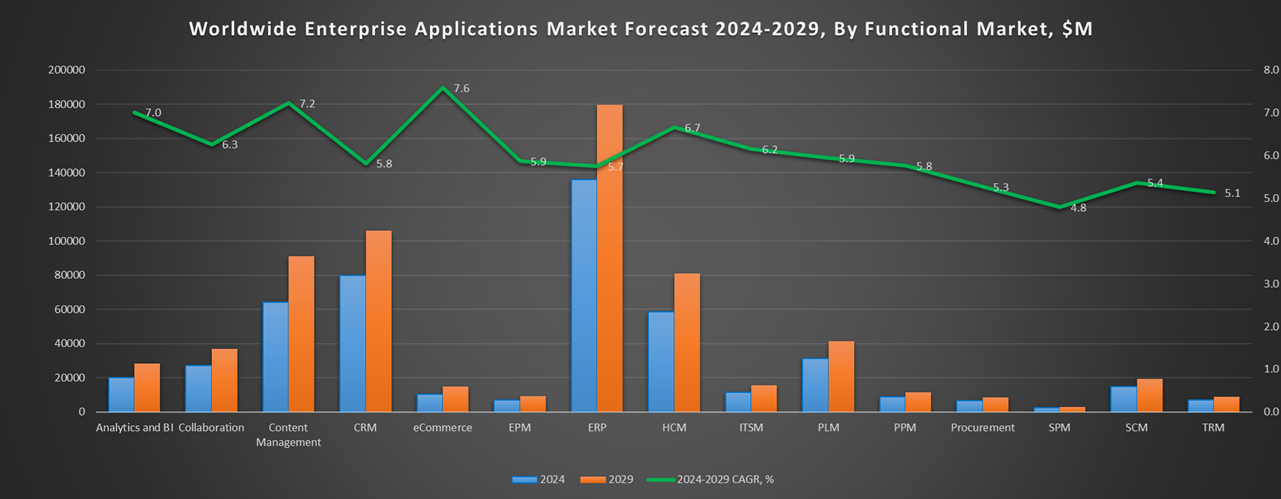
Exhibit 3 provides a forecast of the worldwide enterprise applications by vertical market from 2024 to 2029, highlighting market sizes, year-over-year growth, and compound annual growth rates across different industry sectors from Aerospace and Defense to Utilities.
Exhibit 3: Worldwide Enterprise Applications by Vertical Market Forecast 2024-2029 by Functional Market ($M)
Source: Apps Run The World, July 2025
Exhibit 4 shows our projections for the enterprise applications market by vertical segment, based on the buying preferences and the customer propensity to invest in new software within those industries as they continue to upgrade and replace many legacy industry-specific applications that have been identified and tracked in our Buyer Insight Database.
FAQ – APPS RUN THE WORLD Top 10 State and Local Government Software Vendors, Market Size & Forecast
Q1. What is the global State and Local Government software market size in 2024?
A: The global State and Local Government software market reached $9.7 billion in 2024, marking a 10.4% year-over-year increase.
Q2. Who are the top 10 State and Local Government software vendors in 2024 and their combined share?
A: The top 10 vendors are Tyler Technologies, Microsoft, SAP, Oracle, Workday, Accenture, Constellation Software, IBM, SAS Institute, and Google, together accounting for 45.1% of the total market.
Q3. Which vendor leads the State and Local Government software market in 2024?
A: Tyler Technologies leads the State and Local Government software market in 2024 with an 11.2% market share.
Q4. What is the forecast for the State and Local Government software market through 2029?
A: The market is projected to reach $12.9 billion by 2029, growing at a compound annual growth rate (CAGR) of 5.7%.
Q5. What applications are included in the scope of the State and Local Government software market?
A: The scope includes Public Safety Software, Grants and Performance Management, Computer Assisted Dispatch, Jail Management, Courts Management, Tax Collections, Records Management, Financials, HR, and Procurement.
Q6. Which other State and Local Government software vendors are covered beyond the top 10?
A: The report also profiles vendors such as Accela, Unisys, and Tyler Technologies, among others, offering specialized solutions for state and local government agencies.
Q7. When was this State and Local Government software report published, and by whom?
A: The Top 10 State and Local Government Software Vendors, Market Size & Forecast 2024–2029 report was published in July 2025 by APPS RUN THE WORLD analysts Albert Pang, Misho Markovski, and Marija Ristik, as part of the APPS TOP 500 research program, which benchmarks the revenues and market share of the world’s 1,500+ largest enterprise application vendors.
More Enterprise Applications Research Findings
Based on the latest annual survey of 10,000+ enterprise software vendors, Apps Run The World is releasing a number of dedicated reports, which profile the world’s 1,500 largest Enterprise Applications Vendors ranked by their 2024 product revenues. Their 2024 results are being broken down, sorted and ranked across 16 functional areas (from Analytics and BI to Treasury and Risk Management) and by 21 vertical industries (from Aerospace to Utility), as shown in our Taxonomy. Further breakdowns by subvertical, country, company size, etc. are available as custom data cuts per special request.
Research Methodology
Each year our global team of researchers conduct an annual survey of thousands of enterprise software vendors by contacting them directly on their latest quarterly and annual revenues by country, functional area, and vertical market.
We supplement their written responses with our own primary research to determine quarterly and yearly growth rates, In addition to customer wins to ascertain whether these are net new purchases or expansions of existing implementations.
Another dimension of our proactive research process is through continuous improvement of our customer database, which stores more than one million records on the enterprise software landscape of over 2 million organizations around the world.
The database provides customer insight and contextual information on what types of enterprise software systems and other relevant technologies are they running and their propensity to invest further with their current or new suppliers as part of their overall IT transformation projects to stay competitive, fend off threats from disruptive forces, or comply with internal mandates to improve overall enterprise efficiency.
The result is a combination of supply-side data and demand-generation customer insight that allows our clients to better position themselves in anticipation of the next wave that will reshape the enterprise software marketplace for years to come.
- Databricks, a United States based Professional Services organization with 8000 Employees
- SANKYU, a Japan based Transportation company with 31054 Employees
- Centerview Partner, a United States based Banking and Financial Services organization with 800 Employees
| Logo | Company | Industry | Employees | Revenue | Country | Evaluated |
|---|
