
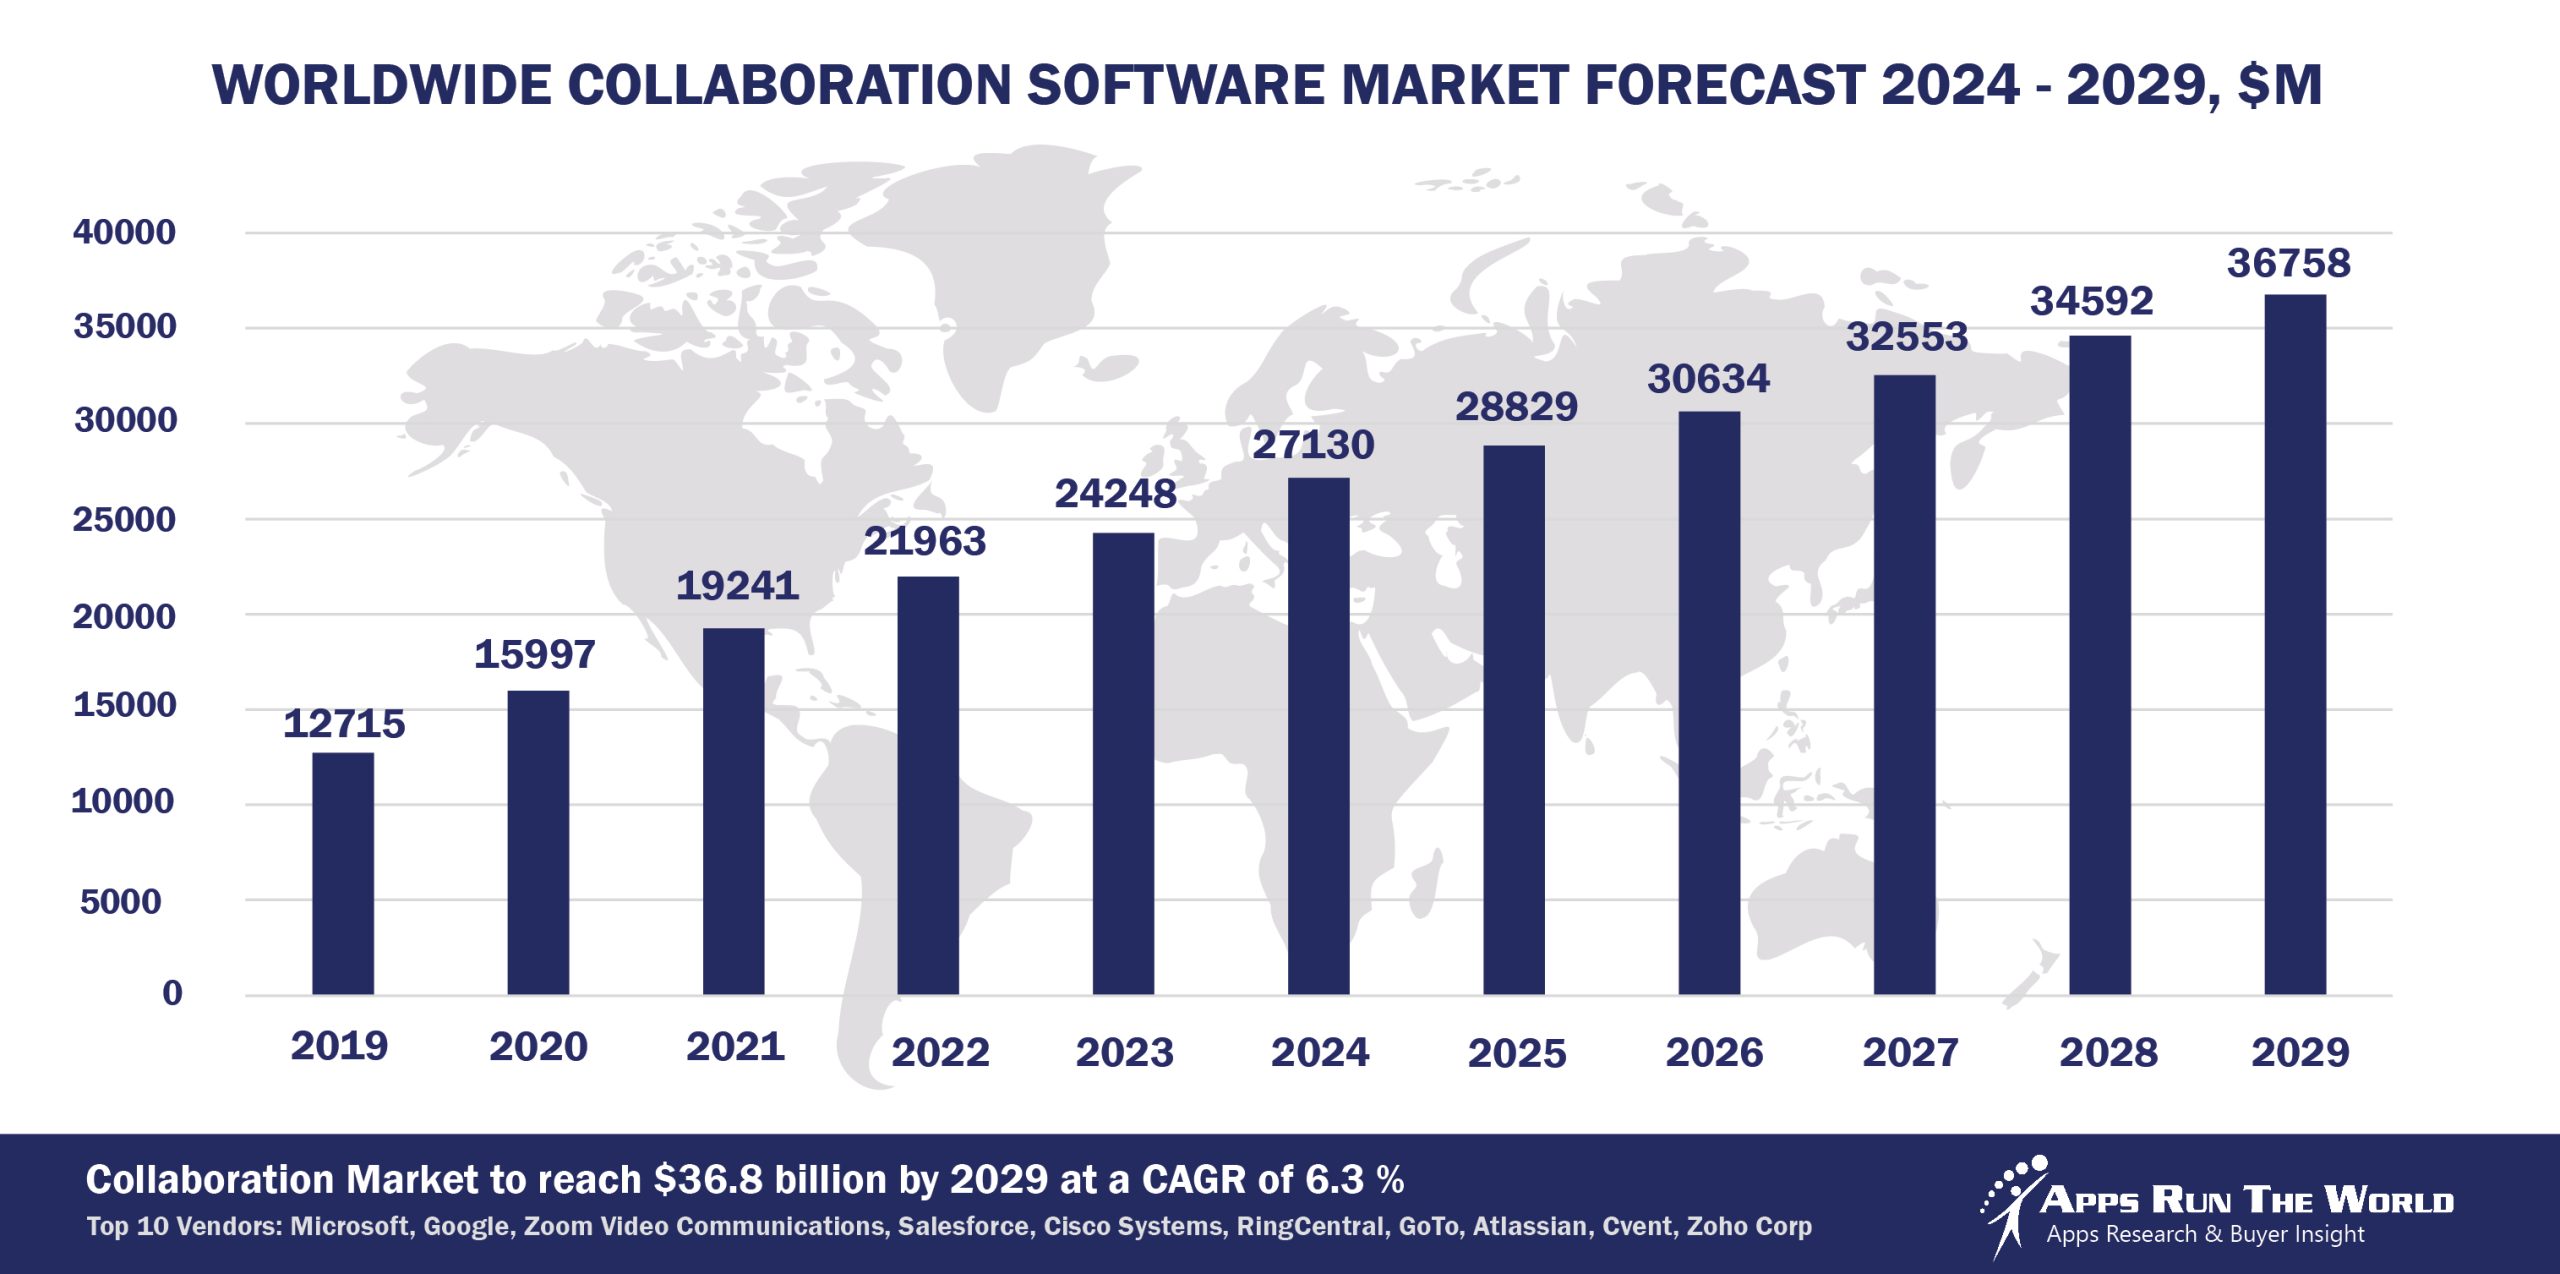
In 2024, the global Collaboration software market grew to $27.1 billion, marking a 11.9% year-over-year increase. The top 10 vendors accounted for 75.7% of the total market, with Microsoft leading at 19.1%, followed by Google, Zoom, Salesforce, and Cisco.
Through our forecast period, the Collaboration applications market size is expected to reach $36.8 billion by 2029, compared with $27.1 billion in 2024 at a CAGR of 6.3%, as shown in the Apps Top 500 Report – Excel Edition [Preview] .
Collaboration applications refer to digital tools and platforms designed to help individuals and teams work together more effectively, regardless of their physical location. These applications facilitate communication, information sharing, task coordination, and joint project management in real-time or asynchronously.
Top 10 Collaboration Software Vendors
Here are the rankings of the top 10 Collaboration software vendors in 2024 and their market shares.
Source: Apps Run The World, July 2025
Other Collaboration software providers included in the report are 3cx, 8×8, Adobe, Amazon Web Services (AWS), Asana, Aurea, Autodesk, Aurea, Axway, Box Inc., Calendly, Citrix, Cybozu, Dalet, Eventbrite, Evernote, Granicus, IBM, Mitel, monday.com, NCR Corporation, ON24, Open Text, Oracle, Pexip, Tencent, Tivian, SAP, ServiceNow, Smartsheet, Qualtrics, and many others.
Vendor Snapshot: Collaboration Market Leaders
 Microsoft
Microsoft is transforming collaboration with the infusion of agentic AI across Microsoft 365. Copilot in Teams now includes intelligent meeting recap, task assignment, and threaded action items across Outlook, Planner, and Loop. In 2025, Microsoft introduced custom Copilot extensibility and the Model Context Protocol (MCP), allowing developers to build persistent, memory-enabled agents capable of participating in chats, initiating workflows, and coordinating across the Microsoft Graph. These agents not only support knowledge workers but also automate team collaboration at scale.
Google continues to evolve Workspace by embedding AI into Gmail, Docs, Meet, and Chat through Duet AI. While Google’s AI agents are not fully autonomous, Workspace developers now have access to Vertex AI Agent Builder and AppSheet to create tailored collaborative experiences. The platform is increasingly allowing agents to summarize meetings, generate documents, and facilitate decisions through real-time content synthesis—bridging asynchronous and live collaboration seamlessly.
Zoom
Zoom is pioneering AI-first collaboration with AI Companion deeply integrated across Meetings, Team Chat, Phone, and Whiteboard. By 2025, Zoom’s agentic architecture enables personal assistants that can attend meetings on behalf of users, follow up on action items, and integrate context across communication streams. Zoom’s federated AI approach allows customers to bring their own models or use Zoom’s LLMs, creating extensible, privacy-respecting agent workflows for enterprise collaboration.
Salesforce Slack
Salesforce is turning Slack into a command center for intelligent collaboration via its Agentforce platform. Slack AI now includes conversational summarization, thread insights, and smart search across enterprise knowledge. Agentforce lets users deploy domain-specific AI agents that interact with Slack, Quip, and external systems to automate coordination, approvals, and customer interactions. The roadmap includes autonomous agents that act across CRM, support, and operations—natively within collaborative threads.
Cisco Webex
Cisco is enhancing Webex with embedded AI capabilities through its Webex AI Assistant and AI Codec. With features like real-time summarization, action capture, and contextual transcription, Cisco is creating a more fluid and intelligent collaboration layer. Cisco’s AI Agent Roadmap includes digital co-pilots that guide customer interactions, hybrid meeting orchestration, and team handoffs in Webex Contact Center—linking internal and external collaboration in one intelligent loop.
RingCentral
RingCentral is integrating agentic AI across RingEX and its omnichannel communications platform. AI-driven summarization, voice intelligence, and the new AI Receptionist (AIR) are improving real-time collaboration and asynchronous task handoffs. While still focused on assistive AI, RingCentral is building the foundations for persistent, cross-channel agents that can support sales, service, and field teams with contextual, real-time interactions across voice and messaging.
GoTo (formerly LogMeIn)
GoTo is embedding AI across its meeting, webinar, and unified communication platforms to simplify collaboration management. It now offers AI-assisted scheduling, session analysis, and attendee engagement scoring. Though not yet deploying persistent agents, GoTo is developing modular AI functions that could evolve into autonomous assistants, especially in virtual event management and internal communications.
Atlassian
Atlassian is rethinking collaboration across distributed teams with AI-driven features in Confluence and Jira. The platform uses generative AI to create and summarize pages, suggest tickets, and automate stand-ups. With the Atlassian Intelligence framework, the company is advancing toward AI agents that facilitate knowledge discovery, documentation, and sprint planning—essentially acting as project coordinators within developer and PMO environments.
Cvent
Cvent is expanding its event management and collaboration stack with AI capabilities for attendee matchmaking, engagement insights, and real-time session feedback. Although its focus remains on event logistics and planning, Cvent is piloting conversational agents that assist with agenda building, personalized outreach, and speaker coordination, laying the groundwork for collaborative AI agents in virtual and hybrid event workflows.
Zoho
Zoho continues to integrate AI across its Workplace suite—Zoho Cliq, Zoho Meeting, and Zoho Mail now feature AI summarization, smart nudges, and conversational search. While Zoho’s AI is primarily assistive today, it’s moving toward embedding intelligent agents capable of managing calendar conflicts, surfacing relevant content, and automating meeting workflows—all within its privacy-centric, vertically integrated ecosystem.
ARTW Technographics Platform: Collaboration customer wins
Since 2010, our research team has been studying the patterns of the Collaboration software purchases, analyzing customer behavior and vendor performance through continuous win/loss analysis. Updated quarterly, the ARTW Technographics Platform provides deep insights into thousands of Collaboration customer wins and losses, helping users monitor competitive shifts, evaluate vendor momentum, and make informed go-to-market decisions.
List of Collaboration customers
Source: ARTW Buyer Insights Technographic Database
Custom data cuts related to the Collaboration Applications market are available:
- Top 200+ Collaboration Applications Vendors and Market Forecast 2024-2029
- 2024 Collaboration Applications Market By Industry (21 Verticals)
- 2024 Collaboration Applications Market By Collaboration Segments and Categories
- 2024 Collaboration Applications Market By Country (USA + 45 countries)
- 2024 Collaboration Applications Market By Region (Americas, EMEA, APAC)
- 2024 Collaboration Applications Market By Revenue Type (License, Services, Hardware, Support and Maintenance, Cloud)
- 2024 Collaboration Applications Market By Customer Size (revenue, employee count, asset)
- 2024 Collaboration Applications Market By Channel (Direct vs Indirect)
- 2024 Collaboration Applications Market By Product
Worldwide Enterprise Application Market
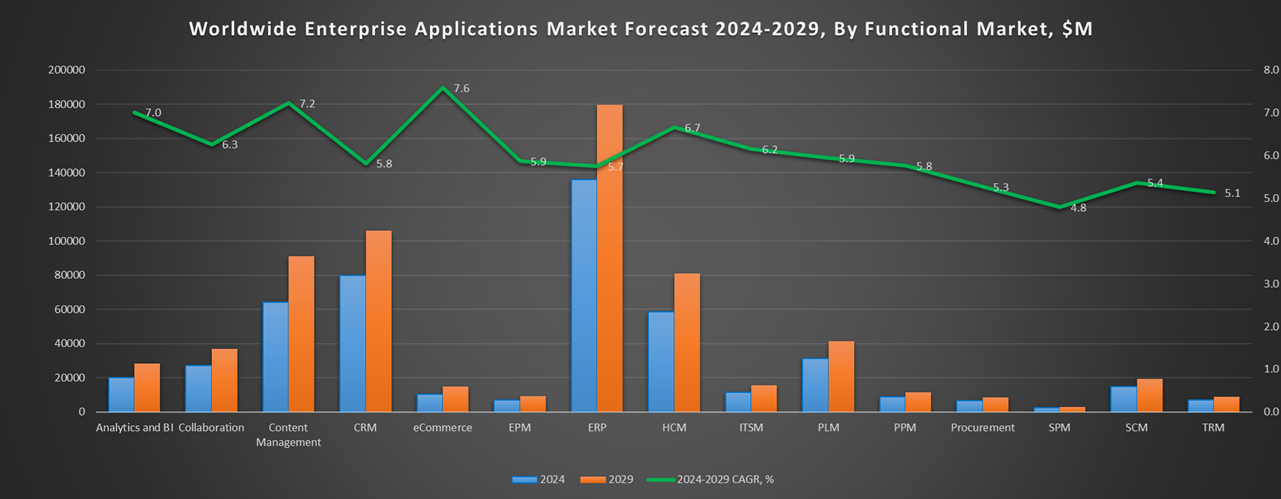
Exhibit 3 provides a forecast of the worldwide enterprise application market from 2024 to 2029, highlighting market sizes, year-over-year growth, and compound annual growth rates across various functional segments. The data shows strong growth in emerging areas like eCommerce, Human Capital Management, and IT Service Management, while traditional segments like ERP and CRM continue to dominate in market size.
Exhibit 3: Worldwide Enterprise Application Market Forecast 2024-2029 by Functional Market ($M)
Source: Apps Run The World, July 2025
Exhibit 4 shows the enterprise applications market by functional area. The highest growth functional markets revolve around smaller segments like eCommerce, Enterprise Performance Management, Sales Performance Management and Treasury and Risk, where first movers remain less established than those that for decades have been entrenched in functional areas like ERP, CRM and PLM.
FAQ – APPS RUN THE WORLD Top 10 Collaboration Software Vendors, Market Size & Forecast
Q1. What is the global collaboration software market size in 2024?
A: The global collaboration software market is estimated at $28.7 billion in 2024, reflecting a 9.2% year-over-year increase due to the shift toward cloud-based tools and growing demand for remote collaboration solutions.
Q2. Who are the top 10 collaboration software vendors in 2024 and their combined share?
A: The top 10 collaboration software vendors in 2024 are Microsoft, Slack Technologies, Zoom Video Communications, Cisco Webex, Google Workspace, Atlassian, Box, Dropbox, Smartsheet, and Trello, capturing 41.8% of the global market.
Q3. Which vendor leads the collaboration software market in 2024?
A: Microsoft leads the collaboration software market in 2024 with a dominant share, driven by the success of Microsoft Teams as the go-to collaboration platform for businesses globally.
Q4. What factors are driving the collaboration software market growth?
A: The growth of the collaboration software market is fueled by the shift to cloud-based platforms, the rise of remote and hybrid work, and the increasing demand for integrated communication tools that enhance productivity and streamline workflows.
Q5. What is the collaboration software market outlook through 2029?
A: The collaboration software market is forecast to grow to $45.2 billion by 2029, at a 7.6% CAGR, as enterprises continue adopting AI-driven collaboration tools and expand their digital ecosystems.
Q6. Which other collaboration software vendors are covered beyond the top 10?
A: The report also profiles Monday.com, Asana, Evernote, Fuze, Wrike, ClickUp, Zoho Workplace, and other collaboration vendors that offer unique features for specialized markets.
Q7. When was this report published and by whom?
A: The Top 10 Collaboration Software Vendors, Market Size and Forecast 2024–2029 report was published on July 23, 2025, by APPS RUN THE WORLD analysts Albert Pang, Misho Markovski, and Aleksandra Markovska, as part of the APPS TOP 500 research program, which benchmarks the revenues and market share of the world’s 1,500+ largest enterprise application vendors.
More Enterprise Applications Research Findings
Based on the latest annual survey of 3,000+ enterprise software vendors, Apps Run The World is releasing a number of dedicated reports, which profile the world’s 500 largest Enterprise Applications Vendors (Apps Top 500) ranked by their 2019-2024 product revenues.
Their 2024 results are being broken down, sorted and ranked across 16 functional areas (from Analytics to Treasury and Risk Management) and by 21 vertical industries(from Aerospace to Utility), as shown in our Taxonomy. Further breakdowns by subvertical, country, company size, etc. are available as custom data cuts per special request.
Research Methodology
Each year our global team of researchers conduct an annual survey of thousands of enterprise software vendors by contacting them directly on their latest quarterly and annual revenues by country, functional area, and vertical market. We supplement their written responses with our own primary research to determine quarterly and yearly growth rates, In addition to customer wins to ascertain whether these are net new purchases or expansions of existing implementations.
Another dimension of our proactive research process is through continuous improvement of our customer database, which stores more than one million records on the enterprise software landscape of over 100,000 organizations around the world. The database provides customer insight and contextual information on what types of enterprise software systems and other relevant technologies are they running and their propensity to invest further with their current or new suppliers as part of their overall IT transformation projects to stay competitive, fend off threats from disruptive forces, or comply with internal mandates to improve overall enterprise efficiency.
The result is a combination of supply-side data and demand-generation customer insight that allows our clients to better position themselves in anticipation of the next wave that will reshape the enterprise software marketplace for years to come.
- Horizon Forest Products, a United States based Distribution organization with 200 Employees
- Ohrwerk Hoergeraete, a Germany based Healthcare company with 130 Employees
- Zoho, a India based Professional Services organization with 19000 Employees
| Logo | Company | Industry | Employees | Revenue | Country | Evaluated |
|---|
