
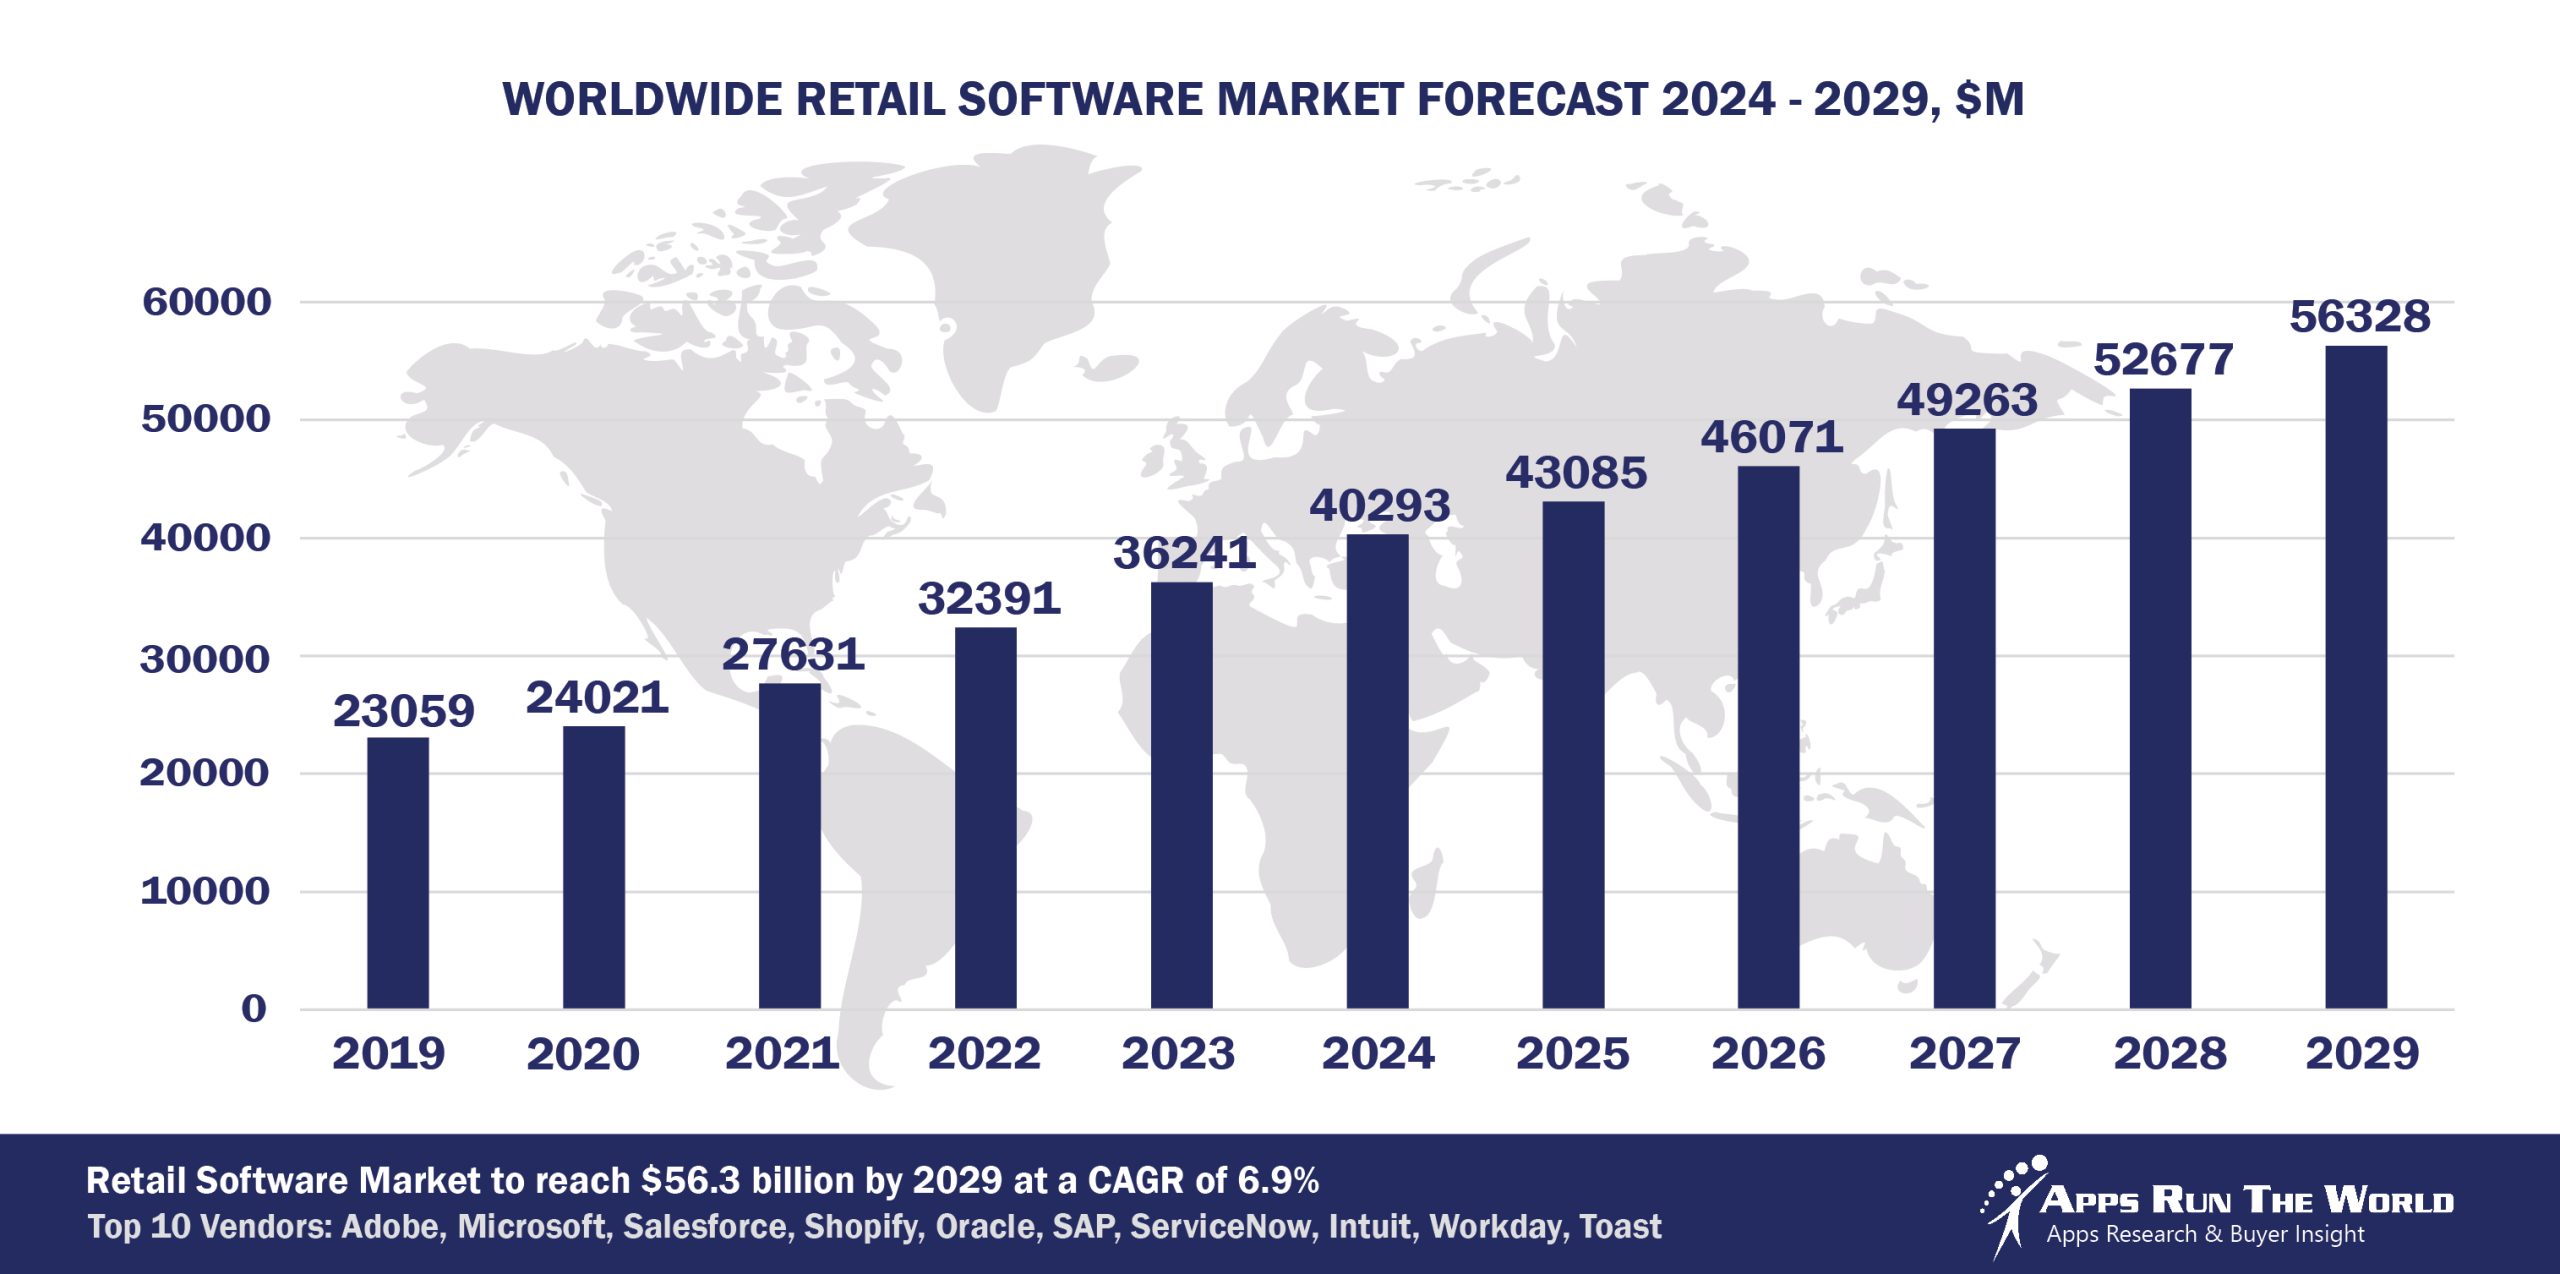
In 2024, the global Retail software market grew to $40.3 billion, marking an 11.2% year-over-year increase. The top 10 vendors accounted for 46% of the total market. Adobe led the pack with a 12.3% market share, followed by Microsoft, Salesforce, and Shopify.
Through our forecast period, the Retail applications market size is expected to reach $56.3 billion by 2029, compared with $40.3 billion in 2024 at a CAGR of 6.9%, as shown in the Apps Top 500 Report – Excel Edition [Preview] .
Retail (Enterprises involved in the sale of goods, services, general and convenience stores, restaurants) – Multi-channel retail software, Point of Sale system, Store management system, Trade Promotions Management, Fresh food software, Price Optimization, Health, and Safety Software, Workplace Risk Management solutions, Retail Execution Management solutions, Financials, HR, Procurement
Multichannel retailing led by eCommerce will dominate the IT agenda of retailers, as the capturing and analysis of real-time customer and inventory data will help facilitate better planning and demand forecasting.
Top 10 Retail Software Vendors in 2024 and their Market Shares
Source: Apps Run The World, July 2025
Other Retail software providers included in the report are: 7shifts, ACI Worldwide, Inc., ADP, Aptos, Atlassian, Aurea, Avalara, Blue Yonder, Cisco Systems, Citrix, Constellation Software Inc., CoStar Group, Dailypay, Dayforce, DocuSign, Inc., Dropbox, Edgeverve, an Infosys company, Epicor, Exact Holding BV, Fiserv, Genesys Telecommunications Laboratories, Global Payments Inc., GoodData, Google, Infor, Informatica, Kingdee, Nice Systems, Open Text Corporation, Partech, Pegasystems, Pitney Bowes, PRGX Global Inc., PTC, Qlik, Roper Technologies, Inc., Sage, SAS Institute, ServiceNow, Sitecore, SolarWinds, SPS Commerce, Inc., Symphony RetailAI, Tango Analytics, Teradata Corporation, TOTVS, UKG, Verint Systems Inc., Visma, Workday, Workwell Technologies, Wunderkind (formerly BounceX) Yonyou, Zendesk, Zoom Video Communications, Zoho Corp. and others.
Vendor Snapshot: Retail Market Leaders
 Adobe
Adobe
Adobe is fusing its commerce and experience platforms with autonomous intelligence to orchestrate deeply personalized and real-time retail journeys. Through integration of agentic AI across Adobe Experience Cloud and Commerce, Adobe is enabling retailers to deploy self-optimizing marketing workflows, autonomous merchandising agents, and generative content pipelines. The recent infusion of Firefly AI into experience orchestration tools underscores a shift toward embedded creative agents that respond to shopper context without human prompting. Adobe’s strategy aligns around modular APIs and low-code automation layers, allowing retail teams to configure, test, and scale intelligent campaigns and offers autonomously, while adaptive learning agents fine-tune customer journeys in production environments.
Microsoft
Microsoft is embedding agentic AI across its retail stack, from Dynamics 365 Commerce to Power Platform, to automate decision-making in pricing, inventory, and customer engagement. With copilots now pervasive across its retail cloud, Microsoft is building toward an ecosystem where autonomous agents collaborate via natural language, generate operational workflows, and act on unified data across commerce, finance, and CRM. Recent updates emphasize fusion of Azure OpenAI and low-code orchestration via Power Automate, allowing retailers to deploy domain-specific agents that anticipate customer demand, manage promotions, or trigger replenishment without manual oversight.
Salesforce
Salesforce is accelerating its shift toward agent-driven retail commerce by embedding autonomous intelligence into its multi-cloud retail suite. With Einstein Copilot integrated across Commerce, Marketing, and Service Clouds, retailers are now deploying context-aware agents that independently manage offer personalization, cross-channel engagement, and service case resolution. Salesforce’s agentic design pattern centers on enabling autonomous customer journeys, where agents adapt in real time based on unified profile signals.
Shopify
Shopify is evolving from a commerce infrastructure provider into an autonomous commerce enabler by embedding intelligent agents into its merchant and buyer workflows. Recent platform enhancements leverage Shopify Magic and AI-driven insights to help retailers automate storefront personalization, content generation, and customer communication. Agentic capabilities are now tightly woven into the Shopify Plus environment, where merchants can configure autonomous promotions and email flows using natural language. With its focus on low-code, intuitive interfaces and embedded intelligence across the POS and fulfillment stack, Shopify is building a modular foundation for retailers to orchestrate end-to-end commerce journeys with minimal human intervention.
Oracle
Oracle is integrating agentic intelligence across its retail and cloud applications to power real-time adaptive retailing. Its unified retail cloud now supports autonomous forecasting, pricing, and workforce optimization through embedded AI agents trained on vertical-specific data models. Oracle’s roadmap emphasizes closed-loop intelligence, where autonomous systems not only analyze data but act on it, automating stock allocations, promotional strategies, and customer engagement. With the acquisition of AI-native startups and a growing emphasis on no-code digital assistant frameworks, Oracle is enabling retailers to deploy conversational, vertically pre-trained agents that execute operational decisions while syncing back into ERP and planning environments.
SAP
SAP’s retail innovation is anchored in the convergence of transactional depth with autonomous intelligence, enabling AI agents to optimize everything from merchandising to customer experience. SAP is embedding generative AI and agentic logic into its Industry Cloud for Retail and S/4HANA, allowing retailers to automate end-to-end processes such as dynamic pricing, store replenishment, and demand planning. Through Joule, SAP’s conversational AI assistant, retail organizations are now deploying domain-aware agents that proactively suggest and execute corrective actions across commerce and supply workflows. SAP’s emphasis on composability, vertical-specific agents, and tight ERP integration positions it as a core enabler of agentic retail operating models.
ServiceNow
ServiceNow is reshaping digital retail operations by extending its Now Platform into a multi-agent automation hub for IT, customer service, and workforce processes. Retailers are leveraging ServiceNow’s AI-powered workflows and low-code tools to deploy autonomous agents that monitor service requests, orchestrate employee scheduling, and resolve operational incidents. The integration of GenAI into workflow automation enables agents to proactively resolve bottlenecks in store operations and supply chain visibility.
Intuit Inc.
Intuit is embedding intelligent automation across its ecosystem to serve small and mid-sized retail businesses with agent-driven financial and marketing workflows. With AI agents now powering customer segmentation, invoice reconciliation, and campaign deployment in QuickBooks and Mailchimp, Intuit is creating an autonomous financial operations layer that adapts in real time. The acquisition of Mailchimp deepened its reach into commerce automation, where generative agents now optimize content, trigger emails, and refine audiences based on behavioral data.
Workday
Workday is transforming workforce and financial operations in retail by deploying autonomous agents that monitor, forecast, and adapt HR and FP&A processes in real time. The integration of generative AI into Workday People Analytics and Adaptive Planning allows retail organizations to surface anomalies, recommend actions, and simulate outcomes autonomously. Workday’s focus on contextual reasoning, conversational UX, and predictive modeling is enabling HR and operations leaders in retail to shift from reactive to agent-led strategic decision-making.
Toast
Toast is rapidly advancing its retail platform, especially in hospitality and QSR segments, by infusing it with intelligent agents that optimize front-of-house and back-office workflows. Toast’s latest innovations include autonomous menu optimization, dynamic labor allocation, and conversational ordering via AI assistants. The integration of agentic logic into inventory, procurement, and cost management modules empowers retailers to run more adaptive, responsive operations.
ARTW Technographics Platform: Retail customer wins
Since 2010, our research team has been studying the patterns of Retail software purchases, analyzing customer behavior and vendor performance through continuous win/loss analysis. Updated quarterly, the ARTW Technographics Platform provides deep insights into thousands of Retail customer wins and losses, helping users monitor competitive shifts, evaluate vendor momentum, and make informed go-to-market decisions.
List of Retail customers
Source: ARTW Buyer Insights Technographic Database
Custom data cuts related to the Retail Applications market are available:
- Top 1000+ Retail Applications Vendors and Market Forecast 2024-2029
- 2024 Retail Applications Market By Functional Market (16 Markets)
- 2024 Retail Applications Market By Country (USA + 45 countries)
- 2024 Retail Applications Market By Region (Americas, EMEA, APAC)
- 2024 Retail Applications Market By Revenue Type (License, Services, Hardware, Support and Maintenance, Cloud)
- 2024 Retail Applications Market By Customer Size (revenue, employee count, asset)
- 2024 Retail Applications Market By Channel (Direct vs Indirect)
- 2024 Retail Applications Market By Product
Worldwide Enterprise Applications by Vertical Market
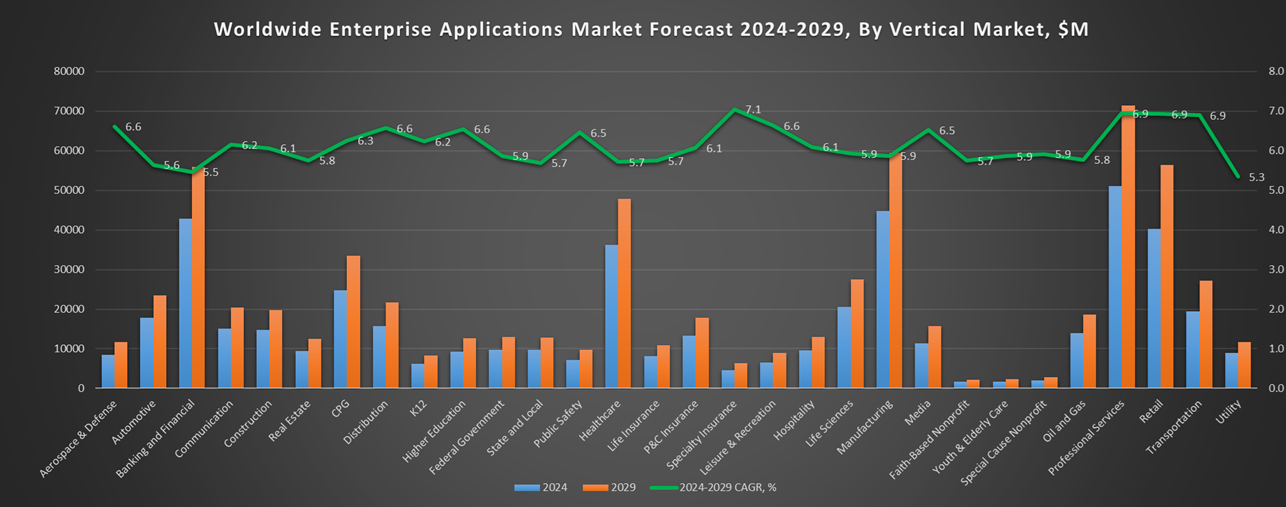
Exhibit 3 provides a forecast of the worldwide enterprise applications by vertical market from 2024 to 2029, highlighting market sizes, year-over-year growth, and compound annual growth rates across different industry sectors from Aerospace and Defense to Utilities.
Exhibit 3: Worldwide Enterprise Applications by Vertical Market Forecast 2024-2029 by Functional Market ($M)
Source: Apps Run The World, July 2025
Exhibit 4 shows our projections for the enterprise applications market by vertical segment, based on the buying preferences and the customer propensity to invest in new software within those industries as they continue to upgrade and replace many legacy industry-specific applications that have been identified and tracked in our Buyer Insight Database.
FAQ – APPS RUN THE WORLD Top 10 Retail Software Vendors, Market Size & Forecast
Q1. What is the global Retail software market size in 2024?
A: The global Retail software market reached $40.3 billion in 2024, growing 11.2% year‑over‑year as omnichannel retail, POS systems, and customer data analytics surged.
Q2. Who are the top 10 Retail software vendors in 2024 and their combined share?
A: The top 10 vendors are Adobe, Microsoft, Salesforce, Shopify, SAP, Oracle, ServiceNow, Intuit, Workday, and Toast, together capturing about 46.0% of the market.
Q3. Which vendor leads the Retail software market in 2024?
A: Adobe leads the Retail software market in 2024 with a 12.3% market share, principally driven by its commerce & experience platforms.
Q4. What is the forecast for the Retail software market through 2029?
A: The market is projected to reach $56.3 billion by 2029, growing at a compound annual growth rate (CAGR) of 6.9%.
Q5. What applications are included in the scope of the Retail software market?
A: It includes multi‑channel retailing, point‑of‑sale systems, store management, trade promotions management, fresh‑food software, price optimization, health & safety software, workplace risk management, retail execution, financials, HR, and procurement.
Q6. Which other Retail software vendors are covered beyond the top 10?
A: Additional vendors profiled include Lightspeed Commerce, Aptos, NCR, BigCommerce, and Cegid, among others, offering POS, inventory management, and specialized systems for specific retail verticals.
Q7. When was this Retail software report published, and by whom?
A: The Top 10 Retail Software Vendors, Market Size & Forecast 2024‑2029 report was published in July 2025 by APPS RUN THE WORLD analysts, as part of the APPS TOP 500 research program, which benchmarks the revenues and market share of the world’s 1,500+ largest enterprise application vendors.
More Enterprise Applications Research Findings
Based on the latest annual survey of 10,000+ enterprise software vendors, Apps Run The World is releasing a number of dedicated reports, which profile the world’s 1,500 largest Enterprise Applications Vendors ranked by their 2024 product revenues. Their 2024 results are being broken down, sorted and ranked across 16 functional areas (from Analytics and BI to Treasury and Risk Management) and by 21 vertical industries (from Aerospace to Utility), as shown in our Taxonomy. Further breakdowns by subvertical, country, company size, etc. are available as custom data cuts per special request.
Research Methodology
Each year our global team of researchers conduct an annual survey of thousands of enterprise software vendors by contacting them directly on their latest quarterly and annual revenues by country, functional area, and vertical market.
We supplement their written responses with our own primary research to determine quarterly and yearly growth rates, In addition to customer wins to ascertain whether these are net new purchases or expansions of existing implementations.
Another dimension of our proactive research process is through continuous improvement of our customer database, which stores more than one million records on the enterprise software landscape of over 2 million organizations around the world.
The database provides customer insight and contextual information on what types of enterprise software systems and other relevant technologies are they running and their propensity to invest further with their current or new suppliers as part of their overall IT transformation projects to stay competitive, fend off threats from disruptive forces, or comply with internal mandates to improve overall enterprise efficiency.
The result is a combination of supply-side data and demand-generation customer insight that allows our clients to better position themselves in anticipation of the next wave that will reshape the enterprise software marketplace for years to come.
- Pacifico Marple Ford United States, a United States based Automotive organization with 56 Employees
- SANKYU, a Japan based Transportation company with 31054 Employees
- Graphics Arts Solution, a United States based Professional Services organization with 50 Employees
| Logo | Company | Industry | Employees | Revenue | Country | Evaluated |
|---|
