
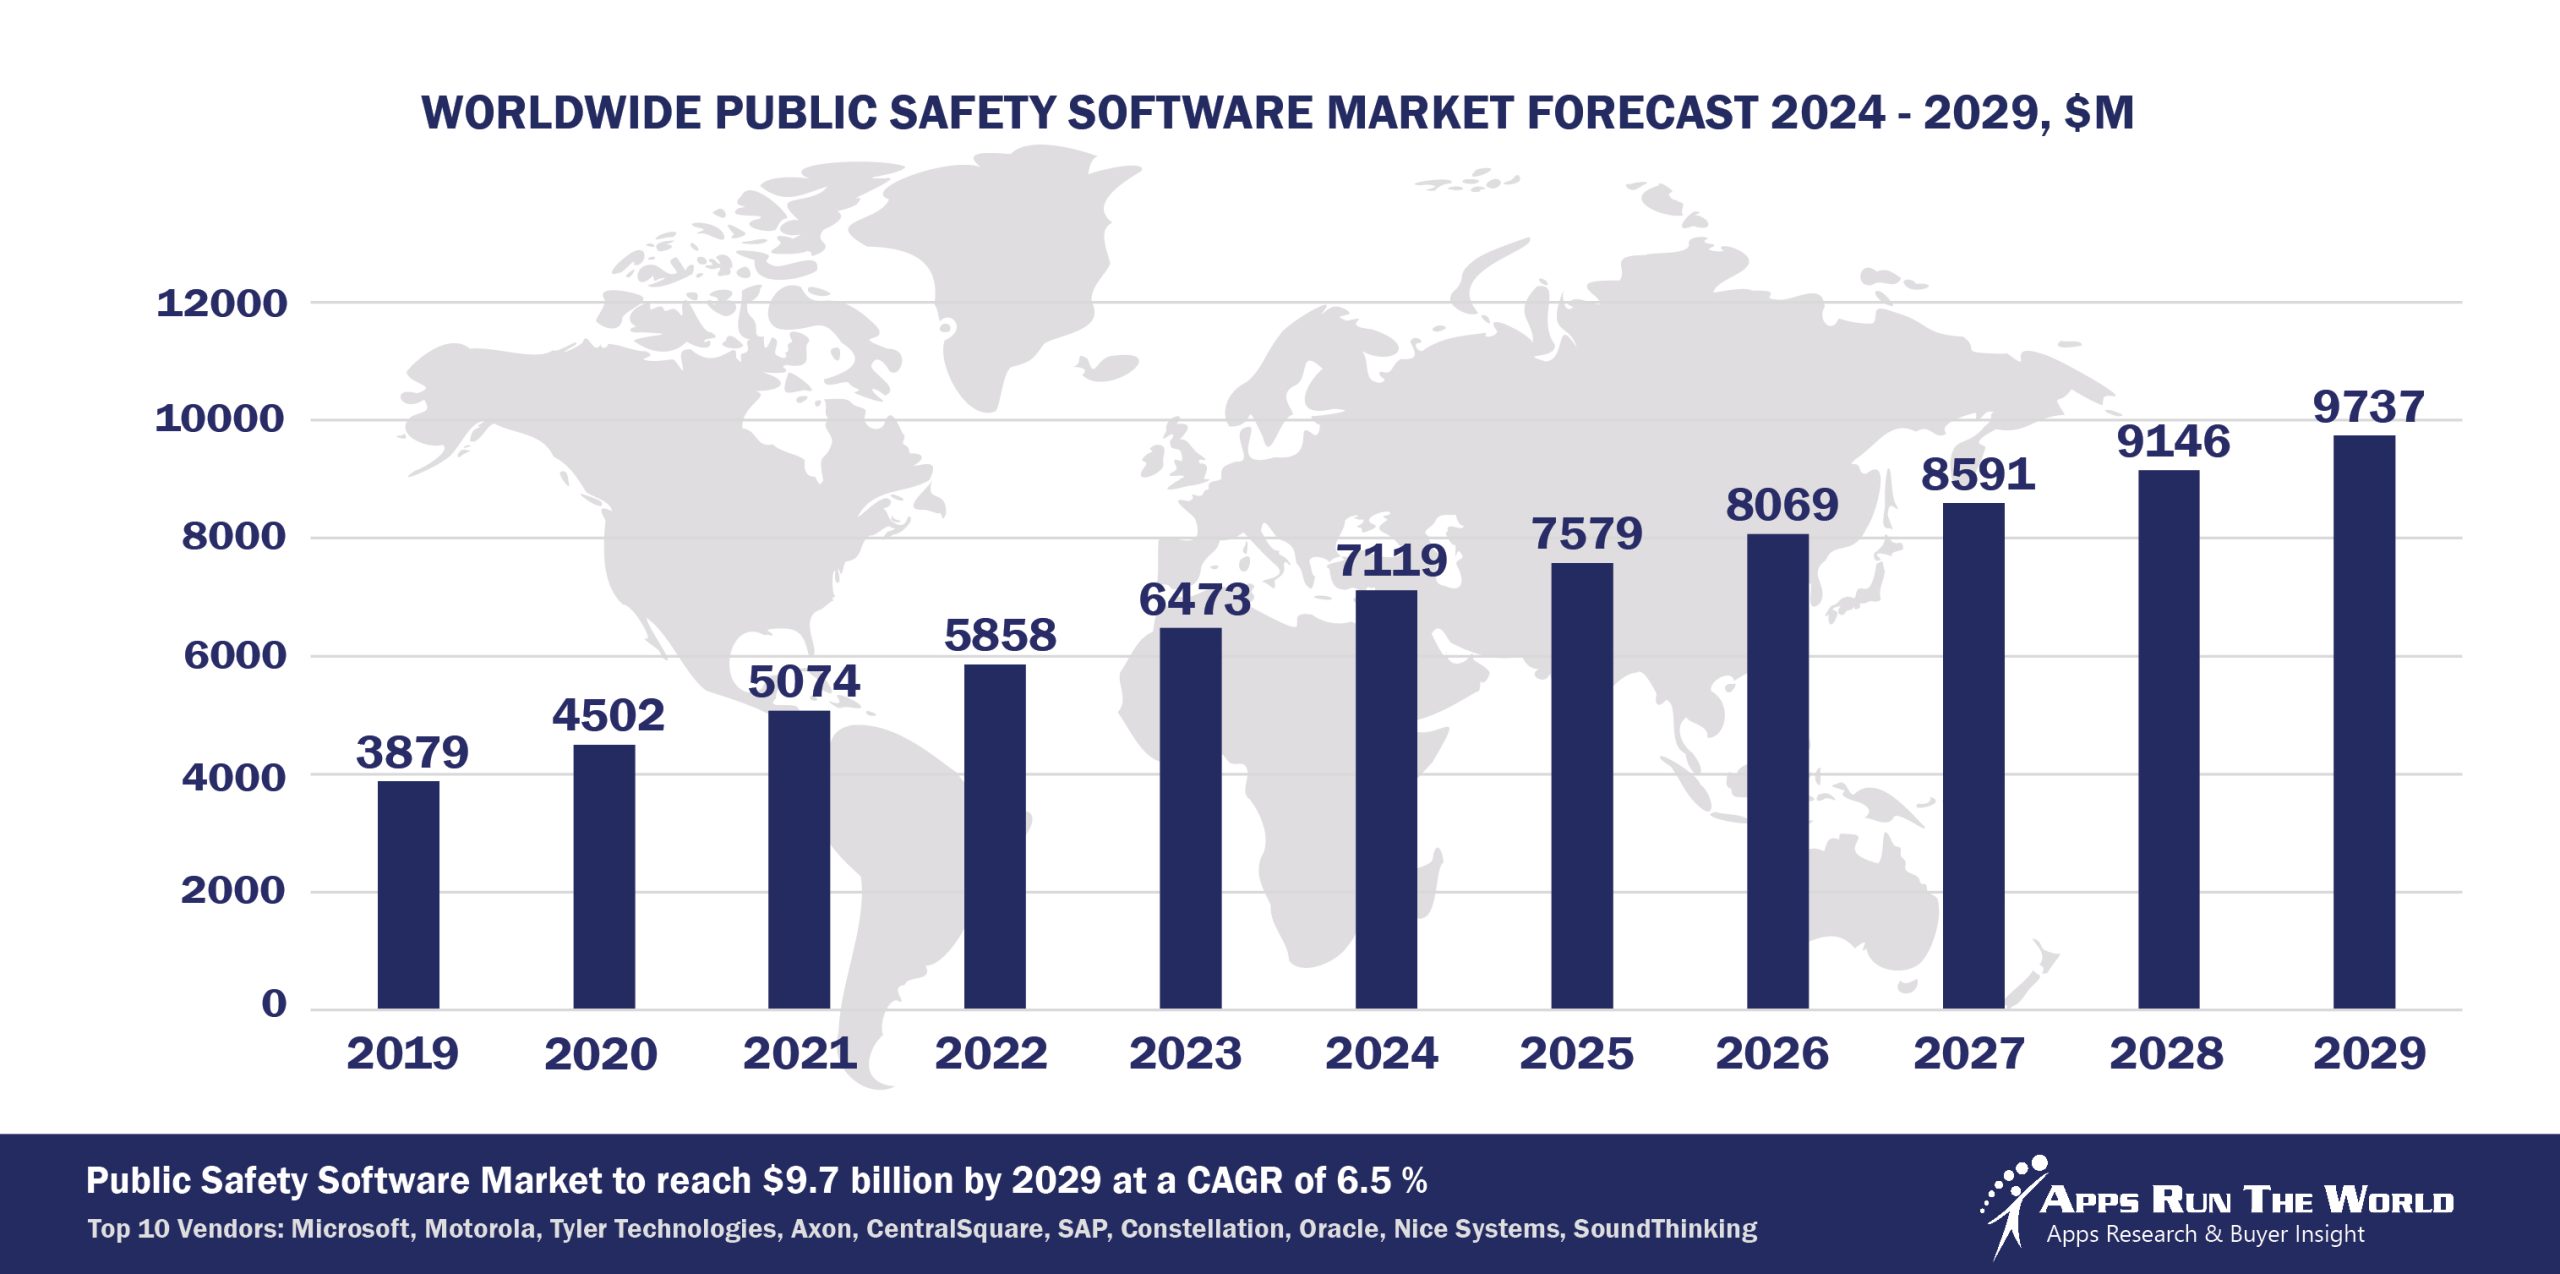
In 2024, the global Public Safety software market grew to $7.1 billion, marking a 10% year-over-year increase. The top 10 vendors accounted for 44.7% of the total market. Microsoft led the pack with a 14.7% market share, followed by Motorola Solutions, Tyler Technologies, and Axon Enterprise.
Through our forecast period, the Public Safety applications market size is expected to reach $9.7 billion by 2029, compared with $7.1 billion in 2024 at a CAGR of 6.5%, as shown in the Apps Top 500 Report – Excel Edition [Preview] .
Public Safety Government (Public Safety government agencies) – Grants and performance management, Law Enforcement, Maintenance Management, Computer Assisted Dispatch, Courts Management, Tax Collections, Records Management, Financials, HR, Procurement
e-Government is the catalyst for new system purchases, especially among developing countries. Apps designed to improve tax revenue collection will continue to take precedence over other front-office systems.
Top 10 Public Safety Software Vendors in 2024 and their Market Shares
Source: Apps Run The World, July 2025
Other Public Safety Government software providers included in the report are: Accela, ACI Worldwide, Inc., Atos (Including Evidian), Adobe, ADP, Advanced, Asseco Group, Atlassian, Avue Technologies, Avenu Insights & Analytics, Berger-Levrault, Box Inc., Blackbaud, Blackboard, Capita Software, Cegid, Celayix Software, CentralSquare Technologies, Civica, CGI Group Inc., Cisco Systems, Citrix, Computer Modeling Group, Dileoz, Dassault Systemes, Dayforce, Dropbox, FIS Global, Fiserv, Google, Genesys Telecommunications Laboratories, Granicus, Hexagon, Hyland, Informatica, Intime Solutions, Itineris, Ivanti, IBM, Infor, Intuit Inc., Kofax, Laserfiche, Journyx, Mark43, NEOGOV, Nice Systems, Oleeo, Open Text Corporation, Oracle, PROACTIS Group, Roper Technologies, Inc., Salesforce, Sopra Steria Group SA, Serviceaide, ServiceNow, ShotSpotter, Silverlake Axis, Squiz, TCP Software, TeamDynamix, Teradata Corporation, TMA Systems, UNIT4, UKG, Visma, Verint Systems Inc., Vitech Systems Group, Wex, Workday, XCD HR Limited, and others.
Vendor Snapshot: Public Safety Market Leaders
 Microsoft
Microsoft is becoming the foundational agentic infrastructure for modern public safety agencies by converging its AI Copilot architecture with Microsoft 365, Teams, and Power Platform. Law enforcement and emergency response organizations are using autonomous agents within Power Automate to handle record redactions, transcribe bodycam footage, and generate case summaries, enabled through secure connectors and low-code logic. The integration of Azure OpenAI models across SharePoint and Teams now allows frontline officers and administrators to interact with policy repositories and case files via conversational interfaces.
Motorola Solutions
Motorola is integrating agentic intelligence directly into dispatch, evidence, and situational command platforms, creating a next-gen public safety fabric where real-time video, sensor data, and voice feeds are analyzed by autonomous agents. Motorola rolled out LLM-powered agent assistants that process incoming 911 transcripts to triage risk level and recommend dispatch responses. These AI agents are embedded across mobile and desktop platforms, not as add-ons but as native orchestration tools. Motorola’s acquisitions (e.g., Calipsa, WatchGuard) have further enabled edge analytics agents to automate object recognition, license plate analysis, and anomaly detection across jurisdictions.
Tyler Technologies
In public safety, Tyler is shifting from modular CAD/RMS systems to agent-embedded orchestration that spans emergency response, case investigation, and judicial handoff. Recent AI pilots use agents to classify incident narratives, recommend reclassifications, and pre-fill investigative details, all done in-line with RMS entry. Tyler is also layering no-code agent builders atop its case and citation management systems, enabling analysts to configure rule-based agents that flag outliers or automate time-sensitive reporting. Across dispatch systems, predictive staffing bots and LLM-enhanced dispatcher assistants are in development, reflecting Tyler’s roadmap to unify financial, operational, and enforcement data into an end-to-end agentic ecosystem that learns and adapts with every incident.
Axon Enterprise
With AI-native tools trained on video and audio from bodycams, Axon now offers autonomous agents that redact footage, summarize video narratives, and tag key events with minimal human input. In 2025, it began piloting multi-agent systems that connect real-time field data with RMS systems, auto-generating evidence chains and even drafting preliminary reports. Axon’s Evidence and Records platforms are becoming agent-first: autonomous tools proactively flag non-compliance risks, coordinate with prosecutors, and assist internal investigations.
Oracle
Oracle delivers end-to-end government ERP, HCM, EPM, and analytics via its government cloud and NetSuite offerings, embedding AI-driven budget forecasting, citizen journey analytics, and case management workflows. Partnerships with digital agencies and public sector integrators support deployed use cases such as benefits administration and procurement automation. Oracle’s approach emphasizes secure cloud microservices and platform extensibility for regulated government environments.
CentralSquare Technologies
CentralSquare is embedding agentic AI deeply across its CAD, RMS, and jail management platforms. The launch of Centerline AI initiative marked a pivotal shift, introducing LLM-powered agents that transcribe dispatcher calls, pre-fill arrest reports, and suggest response prioritization based on historical data and behavioral markers. CentralSquare’s architecture is evolving into a low-code agent platform, allowing non-technical staff to deploy workflow bots that handle resource allocation, evidence tracking, and compliance alerts. Strategic partnerships with language model vendors ensure that these agents operate under strict policy constraints, providing real-time augmentation while maintaining data integrity and regulatory alignment.
SoundThinking (formerly ShotSpotter)
SoundThinking’s most notable 2024 growth driver was the more than twofold expansion of its ResourceRouter customer base, a surge fueled by new patrol-operations capabilities that deliver real-time, field-critical intelligence and improve deployment efficiency amid constrained staffing levels. Equally significant in 2025 is the rollout of LLM-powered natural-language search within CrimeTracer.
SAP
SAP is increasingly positioned as the analytical intelligence core behind public safety’s back office. With AI agents now embedded across planning and workforce modules, agencies can simulate shift allocation based on real-time crime and dispatch data. SAP BTP allows enforcement departments to build conversational dashboards that present budget or staffing variances in natural language, while workflow bots automate federal grant compliance and post-incident fund tracking. Through data federation across finance, HR, and fleet systems, SAP is enabling agencies to embed autonomous analysis agents that monitor KPIs and generate audit-ready narratives.
Constellation Software Inc.
Constellation’s public safety affiliates (Caliber, SmartCOP, Forensic Advantage) are building a federated AI architecture that allows rural and midsize law enforcement agencies to deploy task-specific agents across evidence, dispatch, and case management systems. These agents, trained on local policy and procedures, can pre-fill case files, suggest next steps in investigations, and detect reporting anomalies.
Nice Systems
NICE is embedding agentic AI across its digital evidence and incident intelligence platforms, enabling investigators to query multi-source datasets through natural language and receive context-aware summaries. With LLMs now integrated into its investigation suite, NICE’s agents automate chain-of-custody validation, auto-tag evidence, and even cross-reference disparate datasets to suggest investigative leads. NICE’s agentic roadmap targets full lifecycle autonomy: from intake to court submission, agents handle repetitive, audit-intensive processes while preserving data traceability.
ARTW Technographics Platform: Public Safety customer wins
Since 2010, our research team has been studying the patterns of Public Safety software purchases, analyzing customer behavior and vendor performance through continuous win/loss analysis. Updated quarterly, the ARTW Technographics Platform provides deep insights into thousands of Public Safety customer wins and losses, helping users monitor competitive shifts, evaluate vendor momentum, and make informed go-to-market decisions.
List of Public Safety customers
Source: ARTW Buyer Insights Technographic Database
Custom data cuts related to the Public Safety Government Applications market are available:
- Top 750+ Public Safety Government Applications Vendors and Market Forecast 2024-2029
- 2024 Public Safety Government Applications Market By Functional Market (16 Markets)
- 2024 Public Safety Government Applications Market By Country (USA + 45 countries)
- 2024 Public Safety Government Applications Market By Region (Americas, EMEA, APAC)
- 2024 Public Safety Government Applications Market By Revenue Type (License, Services, Hardware, Support and Maintenance, Cloud)
- 2024 Public Safety Government Applications Market By Customer Size (revenue, employee count, asset)
- 2024 Public Safety Government Applications Market By Channel (Direct vs Indirect)
- 2024 Public Safety Government Applications Market By Product
Worldwide Enterprise Applications by Vertical Market
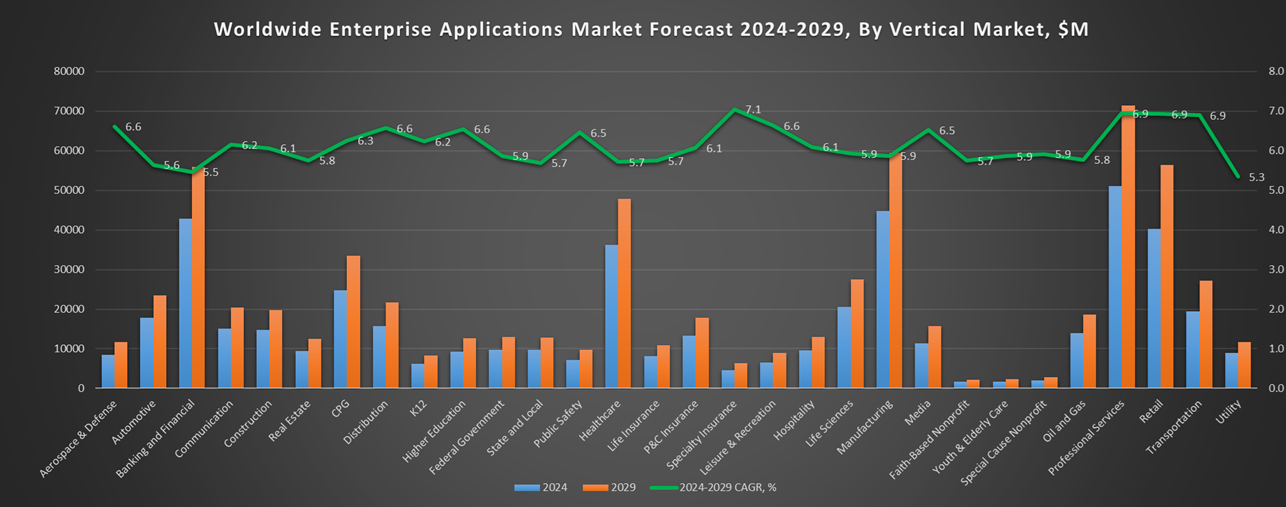
Exhibit 3 provides a forecast of the worldwide enterprise applications by vertical market from 2024 to 2029, highlighting market sizes, year-over-year growth, and compound annual growth rates across different industry sectors from Aerospace and Defense to Utilities.
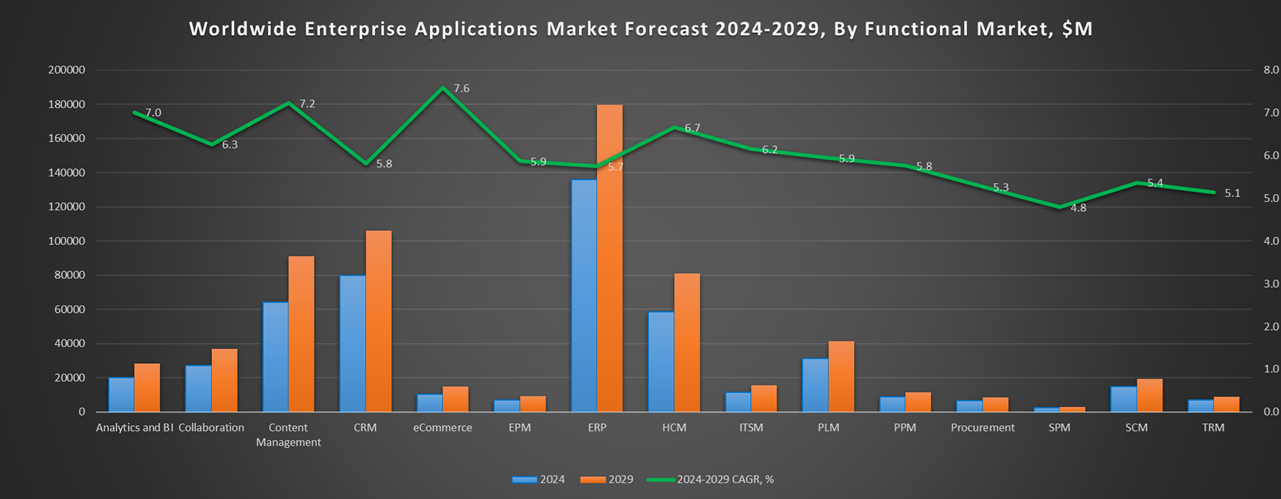
Exhibit 3: Worldwide Enterprise Applications by Vertical Market Forecast 2024-2029 by Functional Market ($M)
Source: Apps Run The World, July 2025
Exhibit 4 shows our projections for the enterprise applications market by vertical segment, based on the buying preferences and the customer propensity to invest in new software within those industries as they continue to upgrade and replace many legacy industry-specific applications that have been identified and tracked in our Buyer Insight Database.
FAQ – APPS RUN THE WORLD Top 10 Public Safety Government Software Vendors, Market Size & Forecast
Q1. What is the global Public Safety software market size in 2024?
A: The global Public Safety software market reached $7.1 billion in 2024, marking a 10% year-over-year increase.
Q2. Who are the top 10 Public Safety software vendors in 2024 and their combined share?
A: The top 10 vendors are Microsoft, Motorola Solutions, Tyler Technologies, Axon Enterprise, Oracle, CentralSquare Technologies, SoundThinking (formerly ShotSpotter), SAP, Constellation Software Inc., and NICE Systems, together accounting for 44.7% of the Public Safety software market.
Q3. Which vendor leads the Public Safety software market in 2024?
A: Microsoft leads the Public Safety software market in 2024 with a 14.7% market share.
Q4. What is the forecast for the Public Safety software market through 2029?
A: The market is projected to reach $9.7 billion by 2029, growing at a compound annual growth rate (CAGR) of 6.5%.
Q5. What applications are included in the scope of the Public Safety software market?
A: The scope includes Computer Assisted Dispatch, Jail Management, Courts Management, Tax Collections, Records Management, Financials, HR, Procurement, and other public safety applications.
Q6. Which other Public Safety software vendors are covered beyond the top 10?
A: The report also profiles vendors such as Caliber, SmartCOP, Forensic Advantage, and other specialized providers in the Public Safety software space.
Q7. When was this Public Safety software report published, and by whom?
A: The Top 10 Public Safety Government Software Vendors, Market Size & Forecast 2024–2029 report was published in July 2025 by APPS RUN THE WORLD analysts Albert Pang, Misho Markovski, and Aleksandra Markovska, as part of the APPS TOP 500 research program, which benchmarks the revenues and market share of the world’s 1,500+ largest enterprise application vendors.
More Enterprise Applications Research Findings
Based on the latest annual survey of 10,000+ enterprise software vendors, Apps Run The World is releasing a number of dedicated reports, which profile the world’s 1,500 largest Enterprise Applications Vendors ranked by their 2024 product revenues. Their 2024 results are being broken down, sorted and ranked across 16 functional areas (from Analytics and BI to Treasury and Risk Management) and by 21 vertical industries (from Aerospace to Utility), as shown in our Taxonomy. Further breakdowns by subvertical, country, company size, etc. are available as custom data cuts per special request.
Research Methodology
Each year our global team of researchers conduct an annual survey of thousands of enterprise software vendors by contacting them directly on their latest quarterly and annual revenues by country, functional area, and vertical market.
We supplement their written responses with our own primary research to determine quarterly and yearly growth rates, In addition to customer wins to ascertain whether these are net new purchases or expansions of existing implementations.
Another dimension of our proactive research process is through continuous improvement of our customer database, which stores more than one million records on the enterprise software landscape of over 2 million organizations around the world.
The database provides customer insight and contextual information on what types of enterprise software systems and other relevant technologies are they running and their propensity to invest further with their current or new suppliers as part of their overall IT transformation projects to stay competitive, fend off threats from disruptive forces, or comply with internal mandates to improve overall enterprise efficiency.
The result is a combination of supply-side data and demand-generation customer insight that allows our clients to better position themselves in anticipation of the next wave that will reshape the enterprise software marketplace for years to come.
- Ezee Fiber, a United States based Communications organization with 150 Employees
- Valdosta State University, a United States based Education company with 1500 Employees
- Stealth International, a United States based Distribution organization with 20 Employees
| Logo | Company | Industry | Employees | Revenue | Country | Evaluated |
|---|
