
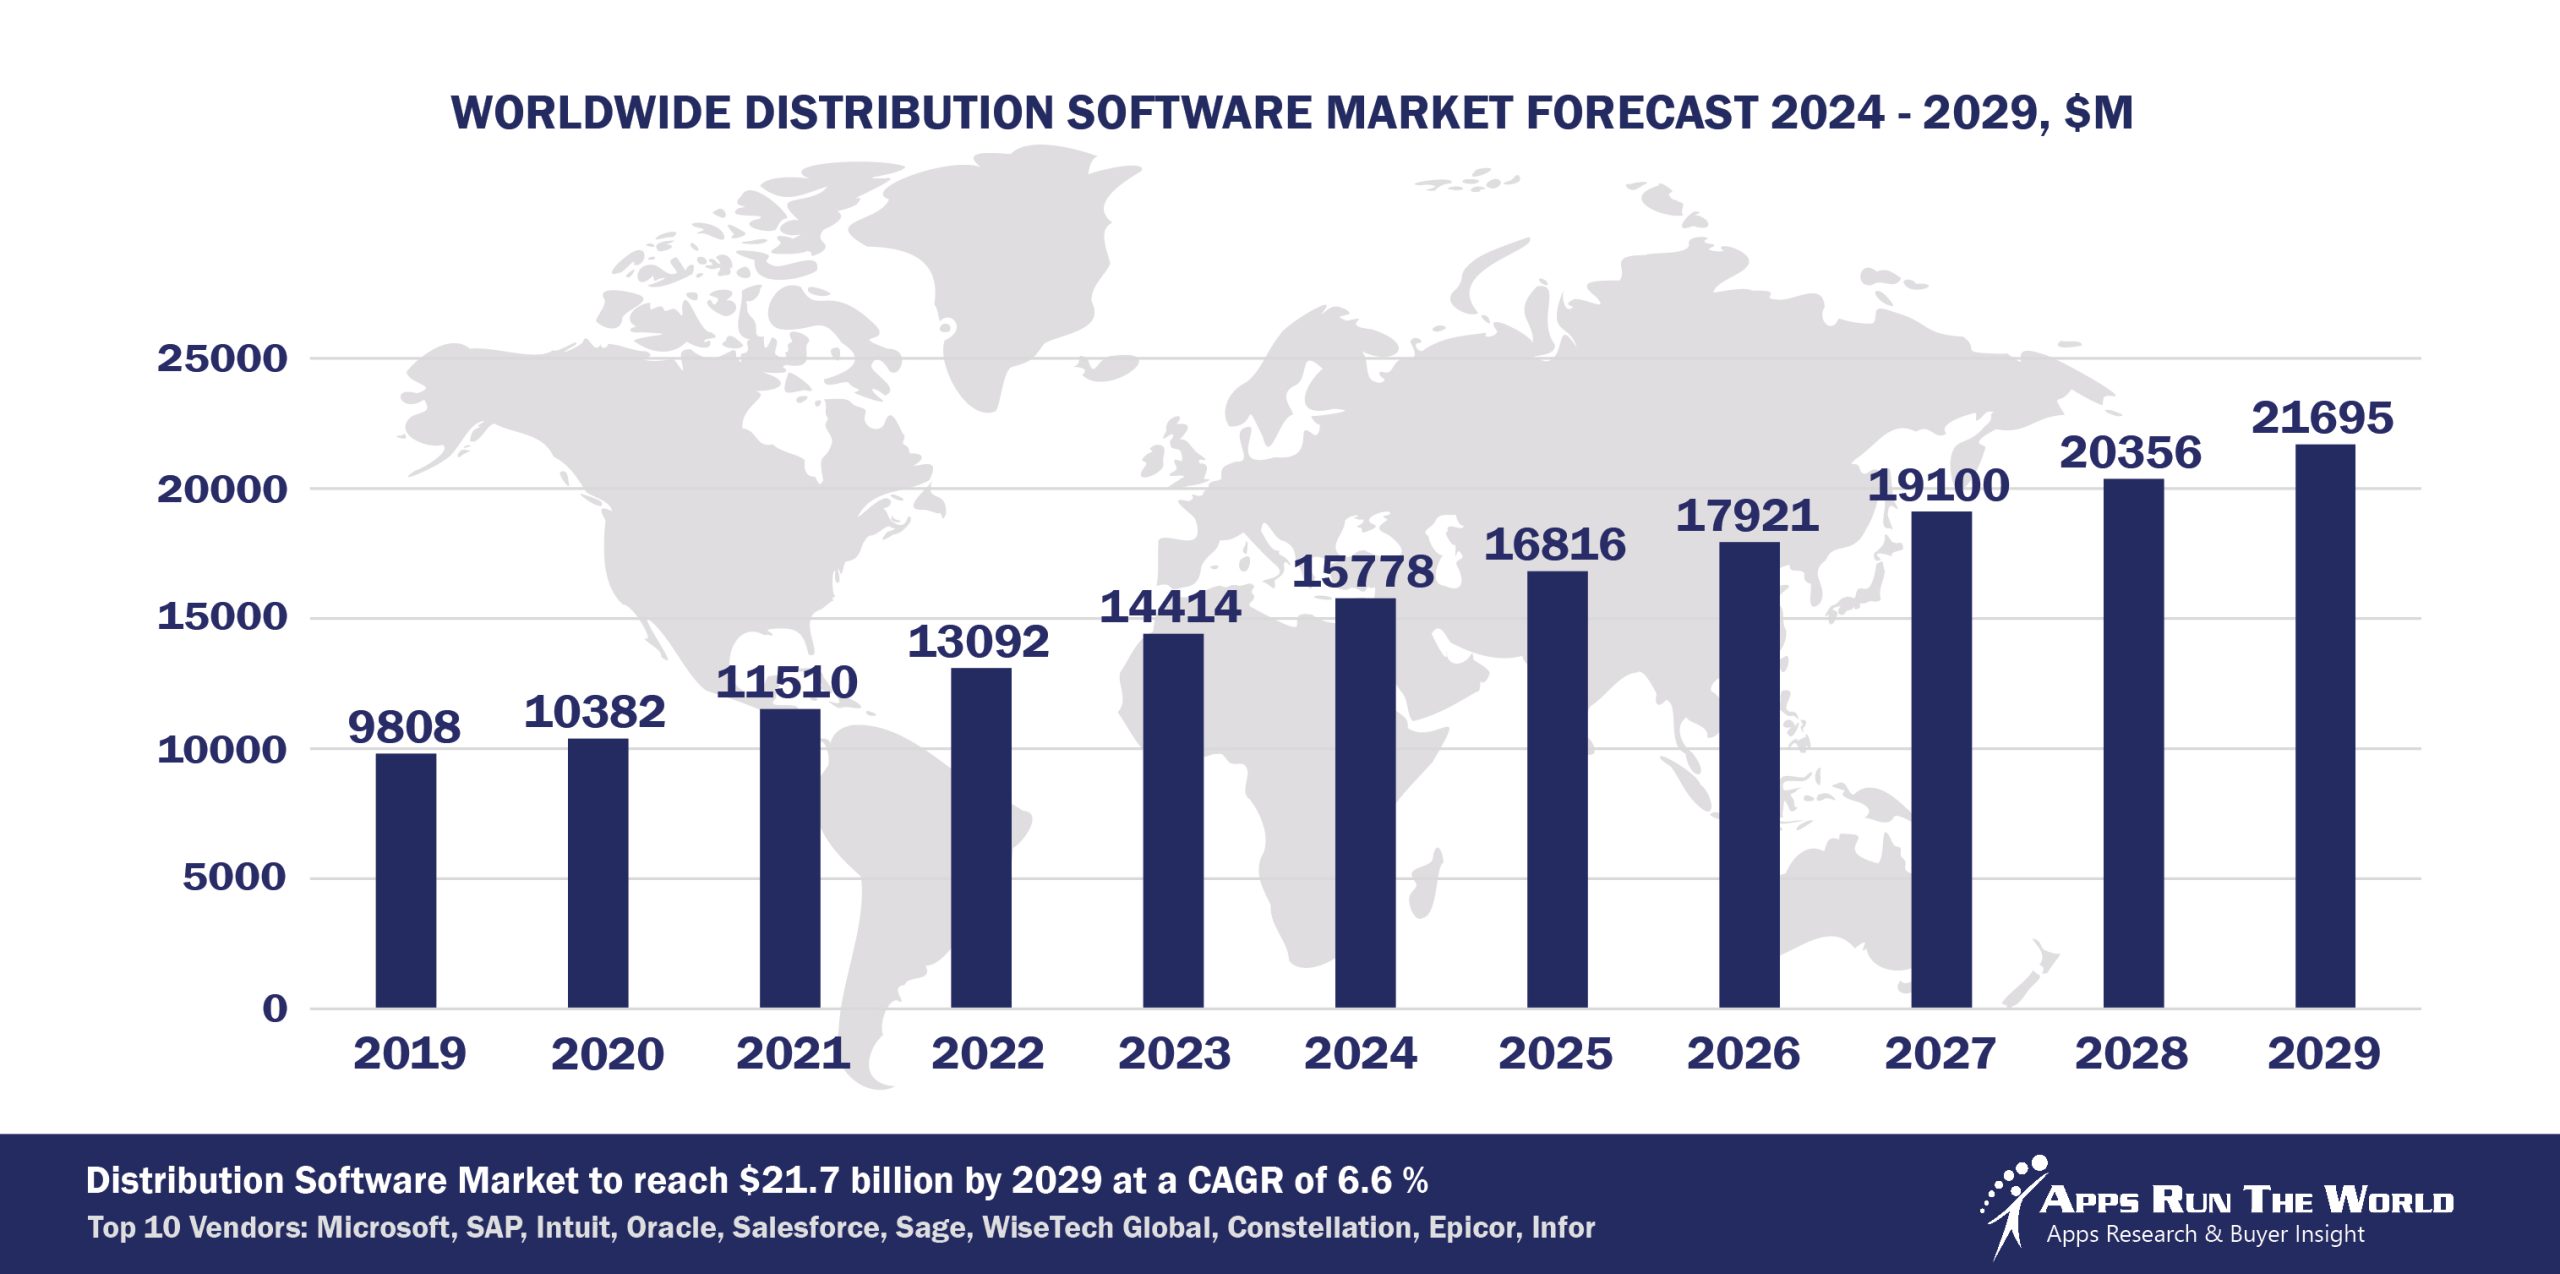
In 2024, the global Distribution software market grew to $15.8 billion, marking a 9.5% year-over-year increase. The top 10 vendors accounted for 47.6% of the total market. Microsoft led the pack with a 21.2% market share, followed by SAP, Intuit, and Oracle.
Through our forecast period, the Distribution applications market size is expected to reach $21.7 billion by 2029, compared with $15.8 billion in 2024 at a CAGR of 6.6%, as shown in the Apps Top 500 Report – Excel Edition [Preview] .
Distribution (Wholesale and distribution of goods to other enterprises) – Supply Chain Management, Transportation Management, Financials, HR, Procurement
Mobility forms the basis of next-generation supply chain systems, while distributors are increasingly gravitating to the Cloud for reductions in total costs of IT ownership.
Top 10 Distribution Software Vendors in 2024 and their Market Shares
Source: Apps Run The World, July 2025
Other Distribution software providers included in the report are Adobe, Aptean, American Software, Atlassian, Cisco Systems, Citrix, Constellation Software Inc., Descartes Systems Group, DocuSign, Inc., Dropbox, ECi Software Solutions, Flexport, GAINSystems, Google, Global Payments Inc., HubSpot, IBM, iptor, Manhattan Associates Inc., Nice Systems, OBIC Co. Ltd., Open Text Corporation, ORTEC, Paycom, Pegasystems, Roper Technologies, Inc., ServiceNow, Teradata Corporation, TOTVS, Trimble, UKG, Vendavo, Verint Systems Inc., Verizon Connect, Visma, Workday, Yonyou, Zoom Video Communications, and others.
Vendor Snapshot: Distribution Market Leaders
 Microsoft
Microsoft continues to expand the capabilities of its Dynamics 365 suite—particularly Finance and Operations (F&O), CRM, and Business Central—to support the evolving needs of the Distribution industry. Recent developments include deeper integration of AI-powered demand forecasting, pricing optimization, and warehouse automation within Dynamics 365 F&O, as well as improved omnichannel customer engagement tools in CRM.
SAP
SAP’s portfolio—including S/4HANA, SuccessFactors, Ariba, and Concur—continues to play a critical role in modernizing distribution operations, particularly around supply chain resilience, procurement, and workforce agility. S/4HANA now embeds AI-driven analytics for demand sensing and inventory optimization, while Ariba enhances supplier collaboration through intelligent sourcing capabilities.
Intuit Inc.
Intuit is strengthening its position in the Distribution segment through enhanced automation and embedded AI features across QuickBooks Enterprise, Payroll, and Mailchimp. QuickBooks Enterprise now offers expanded inventory tracking, barcode scanning, and multi-location stock management tailored for distributors, while Mailchimp supports AI-driven customer segmentation and campaign automation for B2B outreach.
Oracle
Oracle is driving transformation in the Distribution industry through its Cloud SCM and Cloud ERP platforms by embedding AI for real-time supply chain visibility, automated replenishment, and predictive risk management. The platforms now leverage generative AI and digital assistants to optimize order management, logistics orchestration, and financial close processes, offering distributors a unified approach to operational efficiency.
Salesforce
Salesforce is expanding its footprint in the Distribution industry through tailored capabilities within Sales Cloud, and Service Cloud. Distributors are leveraging Salesforce for AI-enhanced sales forecasting, customer service automation, and partner relationship management, with the addition of generative AI features for quote generation and personalized B2B communications.
Sage
Sage is focusing on enhancing distribution-centric functionality in Sage Business Cloud X3 and Sage Intacct, particularly around inventory management, supplier collaboration, and multi-entity financial visibility. Sage Intacct has introduced AI-driven general ledger outlier detection and automated approval workflows, while X3 supports complex supply chain operations with embedded analytics and advanced warehouse features.
WiseTech Global
CargoWise Enterprise and Microlistics WMS, both part of WiseTech Global, continue to expand their relevance in the Distribution sector by enabling end-to-end logistics execution and warehouse optimization. CargoWise integrates customs compliance, freight forwarding, and transportation visibility across global supply chains, while Microlistics offers advanced warehouse automation, slotting optimization, and multi-channel fulfillment support. WiseTech reports over 18,000 logistics organizations using its platforms, with increased traction among distributors seeking unified, scalable solutions to manage complex international and omnichannel distribution flows.
Constellation Software Inc.
CSI Logimax and CSI IDS Dealership Management, both under Constellation Software Inc., are prominent solutions in the distribution sector, particularly for third-party logistics (3PL) providers and dealerships. Logimax offers a robust warehouse management system (WMS) tailored for complex supply chains, enabling efficient inventory management, order fulfillment, and integration with various systems such as ERPs, production planning, and shipping software through APIs/EDI.
Epicor
Epicor’s ERP solutions—Prophet 21, Eclipse, and the broader Epicor ERP suite—are tailored for the distribution industry, offering specialized functionalities to streamline operations. Epicor Prophet 21, a cloud-based ERP system, provides robust inventory management, order processing, and customer relationship tools, enabling distributors to enhance efficiency and responsiveness . Epicor Eclipse, designed for wholesale distributors in electrical, plumbing, HVAC, and PVF sectors, offers advanced warehouse management, real-time inventory tracking, and integrated CRM capabilities . The latest updates to Prophet 21 include the introduction of the Epicor Knowledge Agent, an AI-powered tool that delivers concise, practical answers to product questions, enhancing user experience and operational efficiency.
Infor
Infor CloudSuite Distribution Enterprise is a comprehensive cloud-based ERP designed for large global wholesale distributors, supporting multi-site, multi-company, multi-currency, and multi-language operations with embedded analytics, workflow automation, enterprise search, and document management to enhance decision-making and streamline processes. It features Infor GenAI, which powers the Product Advisor widget for AI-driven product insights and automates tasks such as dunning letter generation and customer credit risk assessment, while also integrating blockchain technology to strengthen supply chain resilience and manufacturing productivity.
ARTW Technographics Platform: Distribution customer wins
Since 2010, our research team has been studying the patterns of Distribution software purchases, analyzing customer behavior and vendor performance through continuous win/loss analysis. Updated quarterly, the ARTW Technographics Platform provides deep insights into thousands of Distribution customer wins and losses, helping users monitor competitive shifts, evaluate vendor momentum, and make informed go-to-market decisions.
List of Distribution customers
Source: ARTW Buyer Insights Technographic Database
Custom data cuts related to the Distribution Applications market are available:
- Top 900+ Distribution Applications Vendors and Market Forecast 2024-2029
- 2024 Distribution Applications Market By Functional Market (16 Markets)
- 2024 Distribution Applications Market By Country (USA + 45 countries)
- 2024 Distribution Applications Market By Region (Americas, EMEA, APAC)
- 2024 Distribution Applications Market By Revenue Type (License, Services, Hardware, Support and Maintenance, Cloud)
- 2024 Distribution Applications Market By Customer Size (revenue, employee count, asset)
- 2024 Distribution Applications Market By Channel (Direct vs Indirect)
- 2024 Distribution Applications Market By Product
Worldwide Enterprise Applications by Vertical Market
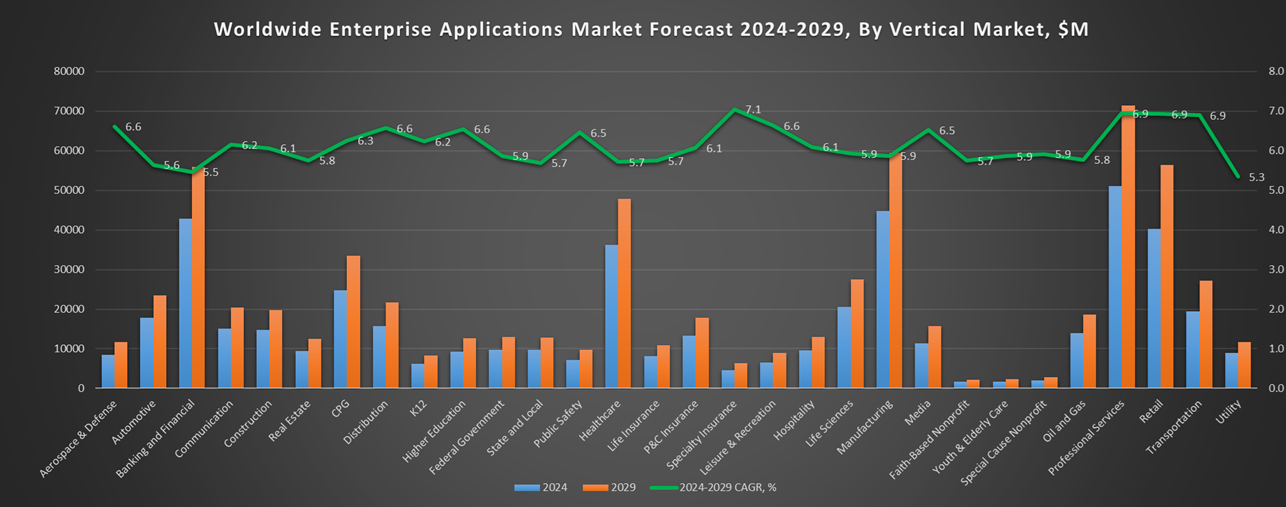
Exhibit 3 provides a forecast of the worldwide enterprise applications by vertical market from 2024 to 2029, highlighting market sizes, year-over-year growth, and compound annual growth rates across different industry sectors from Aerospace and Defense to Utilities.
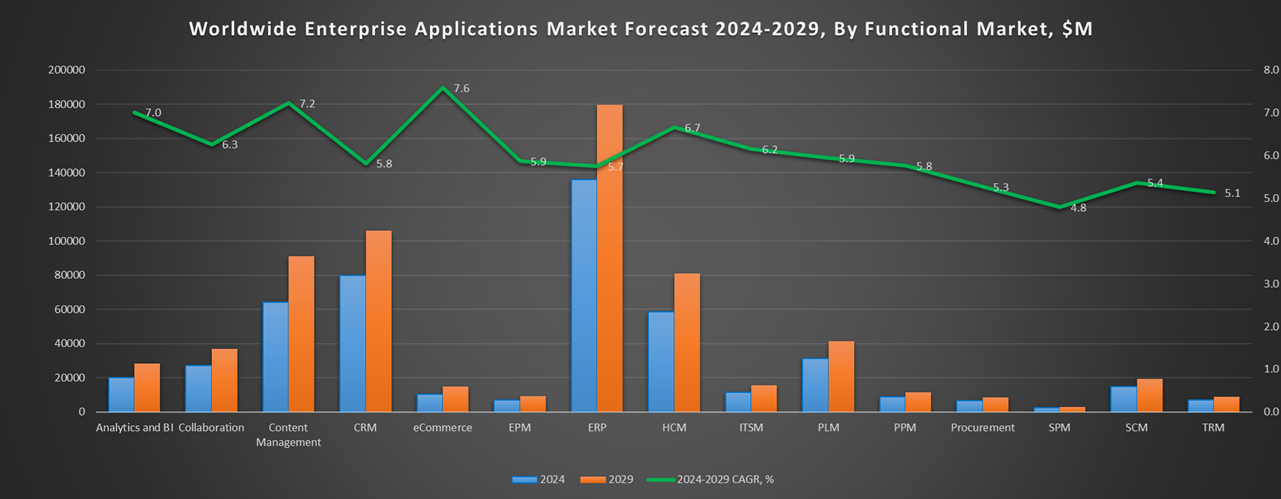
Exhibit 3: Worldwide Enterprise Applications by Vertical Market Forecast 2024-2029 by Functional Market ($M)
Source: Apps Run The World, July 2025
Exhibit 4 shows our projections for the enterprise applications market by vertical segment, based on the buying preferences and the customer propensity to invest in new software within those industries as they continue to upgrade and replace many legacy industry-specific applications that have been identified and tracked in our Buyer Insight Database.
FAQ – APPS RUN THE WORLD Top 10 Distribution Software Vendors, Market Size & Forecast
Q1. What is the global Distribution software market size in 2024?
A: The global Distribution software market reached $15.8 billion in 2024, growing 9.5% year‑over‑year.
Q2. Who are the top 10 Distribution software vendors in 2024, and what share do they hold?
A: The top 10 vendors are Microsoft, SAP, Intuit, Oracle, Salesforce, Sage, WiseTech Global, Constellation Software, Epicor, and Infor, together accounting for 47.6% of the global Distribution software market.
Q3. Which vendor leads the Distribution software market in 2024?
A: Microsoft leads the Distribution software market in 2024 with the highest market share among all vendors.
Q4. What is the forecast for the Distribution software market through 2029?
A: The market is projected to reach $21.7 billion by 2029, growing at a compound annual growth rate (CAGR) of 6.6%.
Q5. What functions are included in the scope of the Distribution software in this report?
A: It includes applications for supply chain management, transportation management, financials, HR, procurement, order processing, warehouse operations, and logistics.
Q6. Which other Distribution software vendors are covered beyond the top 10?
A: The report also profiles Aptean, Blue Yonder, Manhattan Associates, Körber, and Fishbowl, among other emerging and specialized distribution software providers.
Q7. When was this Distribution software report published and by whom?
A: The Top 10 Distribution Software Vendors, Market Size & Forecast 2024‑2029 was published July 2025 by APPS RUN THE WORLD analysts, as part of the APPS TOP 500 research program, which benchmarks the revenues and market share of the world’s 1,500+ largest enterprise application vendors.
More Enterprise Applications Research Findings
Based on the latest annual survey of 10,000+ enterprise software vendors, Apps Run The World is releasing a number of dedicated reports, which profile the world’s 1,500 largest Enterprise Applications Vendors ranked by their 2024 product revenues. Their 2024 results are being broken down, sorted and ranked across 16 functional areas (from Analytics and BI to Treasury and Risk Management) and by 21 vertical industries (from Aerospace to Utility), as shown in our Taxonomy. Further breakdowns by subvertical, country, company size, etc. are available as custom data cuts per special request.
Research Methodology
Each year our global team of researchers conduct an annual survey of thousands of enterprise software vendors by contacting them directly on their latest quarterly and annual revenues by country, functional area, and vertical market.
We supplement their written responses with our own primary research to determine quarterly and yearly growth rates, In addition to customer wins to ascertain whether these are net new purchases or expansions of existing implementations.
Another dimension of our proactive research process is through continuous improvement of our customer database, which stores more than one million records on the enterprise software landscape of over 2 million organizations around the world.
The database provides customer insight and contextual information on what types of enterprise software systems and other relevant technologies are they running and their propensity to invest further with their current or new suppliers as part of their overall IT transformation projects to stay competitive, fend off threats from disruptive forces, or comply with internal mandates to improve overall enterprise efficiency.
The result is a combination of supply-side data and demand-generation customer insight that allows our clients to better position themselves in anticipation of the next wave that will reshape the enterprise software marketplace for years to come.
- Yojo Solutions, a India based Education organization with 1575 Employees
- Zoho, a India based Professional Services company with 19000 Employees
- Humana, a United States based Insurance organization with 95500 Employees
| Logo | Company | Industry | Employees | Revenue | Country | Evaluated |
|---|
