
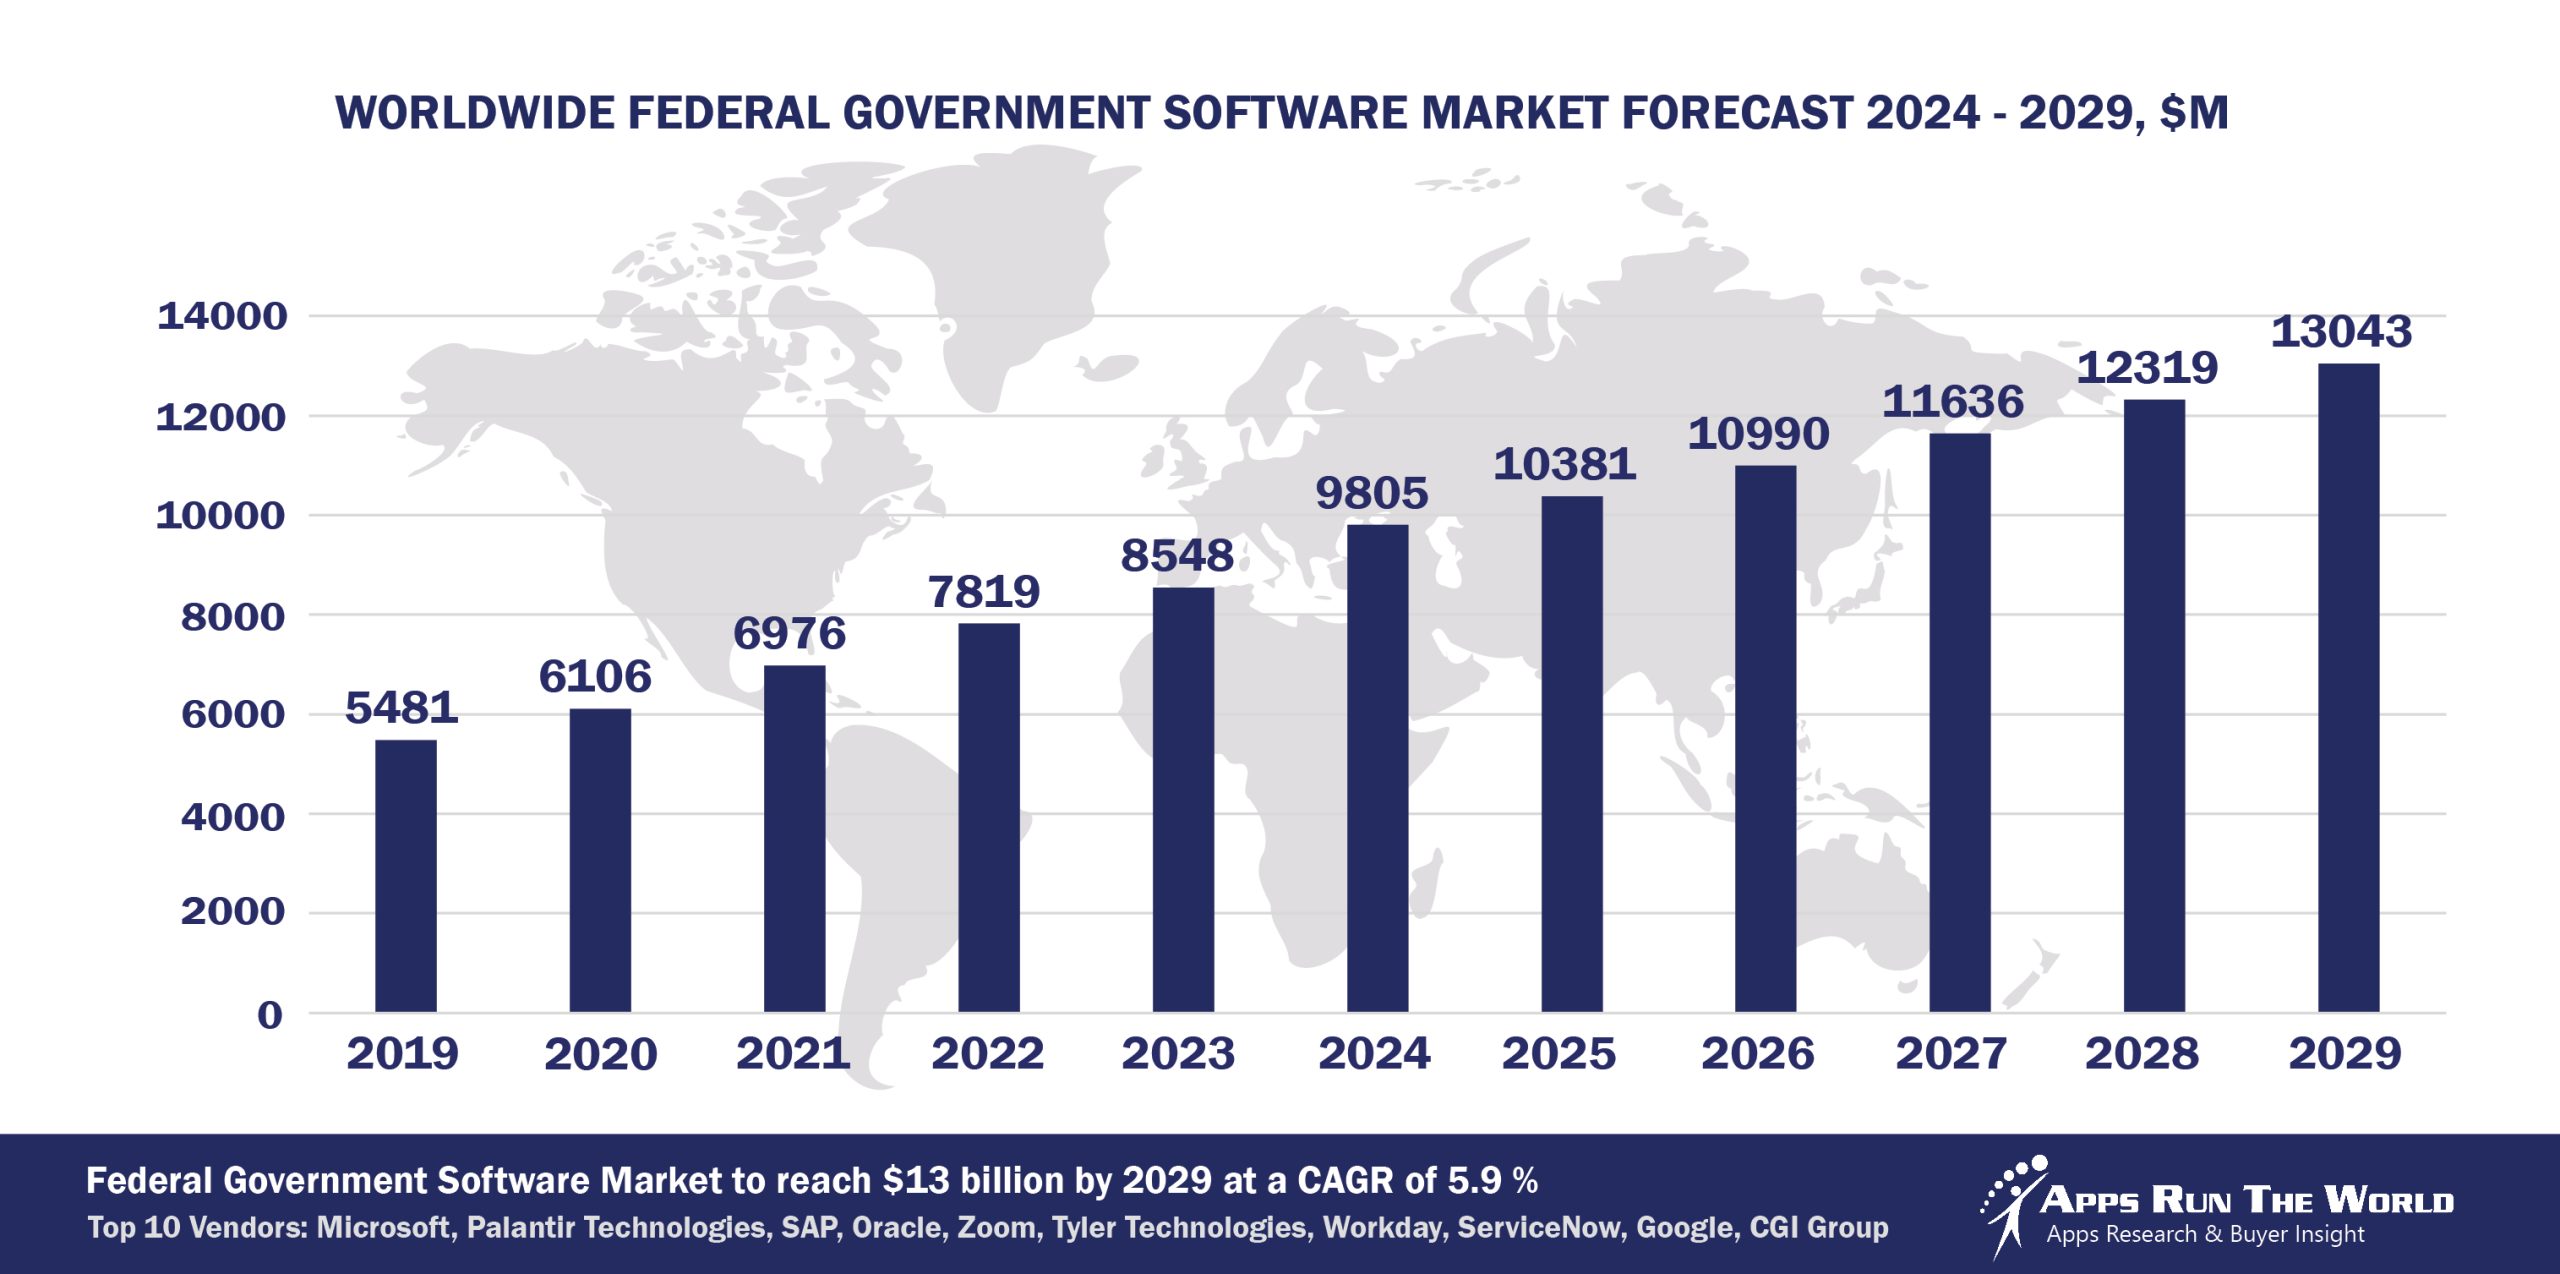
In 2024, the global Federal Government software market grew to $9.8 billion, marking a 14.7% year-over-year increase. The top 10 vendors accounted for 51.3% of the total market. Microsoft led the pack with a 26.7% market share, followed by Palantir Technologies, SAP, and Oracle.
Through our forecast period, the Federal Government applications market size is expected to reach $13 billion by 2029, compared with $9.8 billion in 2024 at a CAGR of 5.9%, as shown in the Apps Top 500 Report – Excel Edition [Preview] .
Federal Government (Federal government agencies) – Grants and performance management, Computer Assisted Dispatch, Courts Management, Tax Collections, Records Management, Financials, HR, Procurement
e-Government is the catalyst for new system purchases, especially among developing countries. Apps designed to improve tax revenue collection will continue to take precedence over other front-office systems.
Top 10 Federal Government Vendors in 2024 and their Market Shares
Source: Apps Run The World, July 2025
Other Federal Government software providers included in the report are Accela, Atos (Including Evidian), ACI Worldwide, Inc., Journyx, Adobe, ADP, Advanced, Asseco Group, Atlassian, Avue Technologies, Berger-Levrault, Blackbaud, Blackboard, Capita Software, Cegid, Celayix Software, CentralSquare Technologies, Dayforce, Civica, Cisco Systems, Citrix, Computer Modeling Group, Dileoz, Dropbox, DocuSign, Inc., Dassault Systemes, FIS Global, Fiserv, Google, Granicus, Hexagon, Informatica, Infor, Intime Solutions, Itineris, Ivanti, IBM, Kofax, Laserfiche, Motorola Solutions, NEOGOV, Nice Systems, Oleeo, Open Text Corporation, OpenGov Inc., PROACTIS Group, Roper Technologies, Inc., Salesforce, Serviceaide, ServiceNow, SAS Institute, Silverlake Axis, Squiz, TCP Software, TeamDynamix, Teradata Corporation, TechnologyOne, TMA Systems, UNIT4, Visma, Verint Systems Inc., Vitech Systems Group, West Technology Grop, Wex, Workday, XCD HR Limited, and others.
Vendor Snapshot: Federal Government Market Leaders
 Microsoft
Microsoft’s federal platform has evolved into an AI-centric backbone for agencies, embedding conversational Copilots and orchestration agents across its cloud and productivity suite. Recent updates have introduced Copilot Tuning in Government Community Cloud, letting teams spin up domain-tuned AI agents without code, and a multi-agent orchestration layer in Azure Government, so agencies can assemble chains of specialized bots that collaborate autonomously. This agent framework is now surfaced directly inside Teams, Outlook, and Intune consoles, enabling truly seamless, end-to-end workflows, from automatically triaging security alerts to generating policy-compliant spending forecasts, while preserving rigorous FedRAMP and CMMC controls.
Palantir Technologies
Palantir deepened its Foundry platform with Autonomous Analytic Agents that can continuously monitor classified and unclassified data lakes, detect emerging threats or anomalies, and enact pre-authorized response playbooks, all with minimal human touchpoints. Palantir released a no-code experiment builder that empowers mission teams to configure and deploy custom AI agents for cybersecurity, logistics forecasting, or personnel readiness. These agents can converse via secure chat interfaces or integrate with agency ticketing systems, ensuring Palantir’s roadmap remains focused on a self-learning, programmatically extensible analytic fabric tailor-made for complex government missions.
SAP
SAP’s federal cloud portfolio embeds its Joule AI copilot and autonomous process agents into every layer of the enterprise stack. Agencies can use low-code tools on the Business Technology Platform to spin up agents that automate travel-and-expense approvals, orchestrate multi-party procurement workflows, or forecast supply-chain disruptions across government distribution networks. A strategic partnership added classified-data support for SAP’s intelligent planning agents—allowing defense and civilian agencies to run “what-if” simulations in real time.
Oracle
Oracle’s Government Cloud has been hardened for FedRAMP High and now offers an Agent Studio for building AI-powered processing bots that work across finance, HR, and asset management. Oracle rolled out pre-built autonomous agents for P-card auditing and grant reconciliation that can ingest PDF invoices, cross-reference them against contract databases, and either approve or flag exceptions automatically. Oracle’s roadmap is uniting Student, ERP, HCM, and analytics under one self-optimizing platform tailored to federal operations.
Zoom Video Communications
Zoom’s shift from pure conferencing to an AI-driven collaboration hub is evident in its Government-grade offering. Zoom introduced Smart Room Agents, embedded bots that handle session summaries, action-item tracking, and real-time language translation for classified briefings. These agents can also integrate with agency calendars and ticketing tools, auto-scheduling follow-up workshops, or deploy secure transcripts into case-management systems. With a new low-code SDK, agencies can build custom bots that join Zoom sessions, monitor keywords, and trigger automated workflows, making Zoom a front-door for both collaborative and autonomous operations.
Tyler Technologies
Tyler’s government ERP suite now includes Smart Case Agents within its workforce and case-management solutions. Tyler launched an autonomous review agent that triages incoming EEO complaints, categorizes them, and generates draft investigation workflows, all within the same secure environment. On the finance side, its Munis ERP now features AI-driven forecasting agents that simulate revenue impacts under different tax or fee scenarios, then feed approved recommendations back into budget-building workflows.
Workday
Workday’s Government Cloud has embedded its People Assistant and Financial Companion AI agents directly into agency pay, HR, and budgeting modules. These assistants autonomously reconcile ledger entries, suggest staffing mix optimizations based on mission priorities, or automatically enroll personnel in mandatory training if certifications lapse. The recent release of a no-code agent builder within Workday Studio allows civilian and defense HR teams to craft their own conversational workflows, such as automated security clearance status checks, while preserving strict data residency and audit requirements.
ServiceNow
ServiceNow’s Federal Digital Services suite treats AI agents as first-class citizens: Now Assist bots can not only handle tier-1 IT tickets but also orchestrate multi-system processes—like deprovisioning user access across email, VPN, and database systems in a single, autonomous workflow. The 2025 release extends generative scheduling agents for mission-critical asset maintenance, and the low-code App Engine now includes AI-driven form-and-flow generation from simple natural-language prompts. ServiceNow’s vision is to transform all public-sector case, HR, and facilities management into a continuous, self-optimizing cycle of agentic workflows and conversational touchpoints.
Google is advancing federal operations by embedding agentic AI and autonomous systems across its cloud and analytics platforms, enabling agencies to automate complex workflows and data-driven decision-making. Its FedRAMP High–authorized AI environment integrates reasoning and planning capabilities, while recent investments in AI infrastructure in Oklahoma expand secure, scalable deployments. Enhancements to its low-code/no-code developer tools further empower agencies to create intelligent agents and conversational interfaces with minimal coding, accelerating adoption across departments.
CGI Group
CGI is at the forefront of integrating agentic AI into its federal solutions, notably through its Momentum and Advantage platforms. The latest Momentum 8.2 release introduces the Momentum AI Assistant, an intelligent agent designed to streamline workflows and enhance decision-making within federal agencies. This advancement reflects CGI’s commitment to embedding autonomous capabilities that reduce manual intervention and improve operational efficiency. The company’s approach includes the development of accelerators like CGI PulseAI and Intelligent Modular Agent, which facilitate the deployment of agentic AI solutions across various federal operations.
ARTW Technographics Platform: Federal Government customer wins
Since 2010, our research team has been studying the patterns of Federal Government software purchases, analyzing customer behavior and vendor performance through continuous win/loss analysis. Updated quarterly, the ARTW Technographics Platform provides deep insights into thousands of Federal Government customer wins and losses, helping users monitor competitive shifts, evaluate vendor momentum, and make informed go-to-market decisions.
List of Federal Government customers
Source: ARTW Buyer Insights Technographic Database
Custom data cuts related to the Federal Government Applications market are available:
- Top 750+ Federal Government Applications Vendors and Market Forecast 2024-2029
- 2024 Federal Government Applications Market By Functional Market (16 Markets)
- 2024 Federal Government Applications Market By Country (USA + 45 countries)
- 2024 Federal Government Applications Market By Region (Americas, EMEA, APAC)
- 2024 Federal Government Applications Market By Revenue Type (License, Services, Hardware, Support and Maintenance, Cloud)
- 2024 Federal Government Applications Market By Customer Size (revenue, employee count, asset)
- 2024 Federal Government Applications Market By Channel (Direct vs Indirect)
- 2024 Federal Government Applications Market By Product
Worldwide Enterprise Applications by Vertical Market
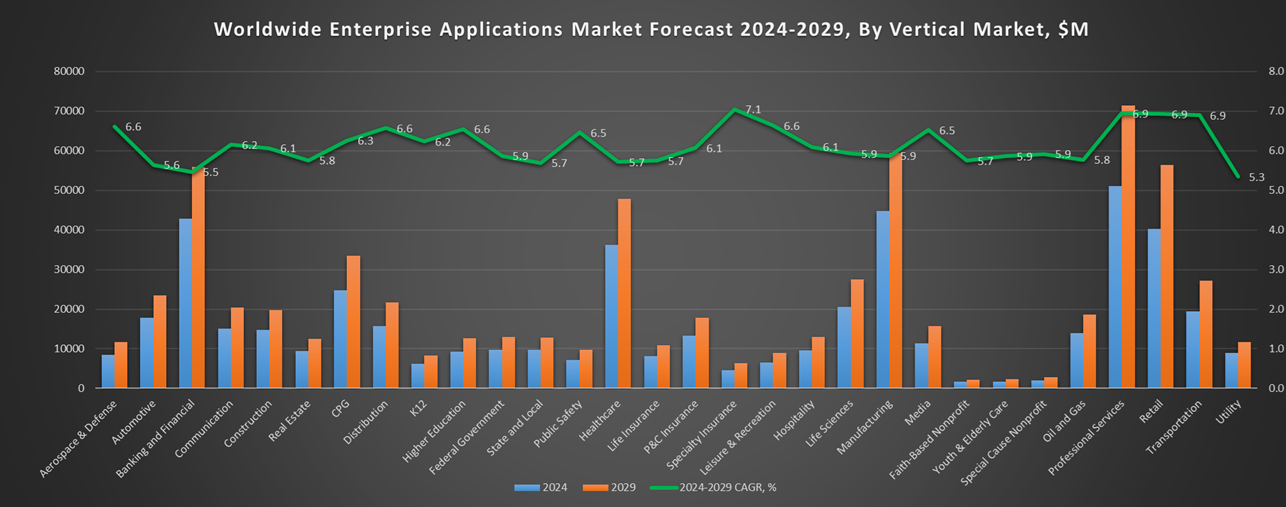
Exhibit 3 provides a forecast of the worldwide enterprise applications by vertical market from 2024 to 2029, highlighting market sizes, year-over-year growth, and compound annual growth rates across different industry sectors from Aerospace and Defense to Utilities.
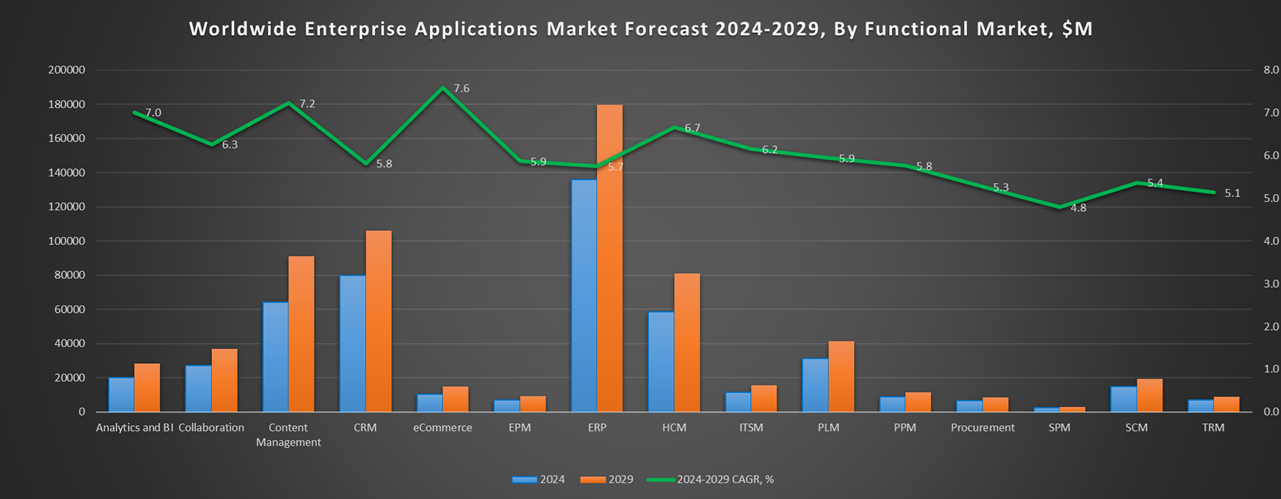
Exhibit 3: Worldwide Enterprise Applications by Vertical Market Forecast 2024-2029 by Functional Market ($M)
Source: Apps Run The World, July 2025
Exhibit 4 shows our projections for the enterprise applications market by vertical segment, based on the buying preferences and the customer propensity to invest in new software within those industries as they continue to upgrade and replace many legacy industry-specific applications that have been identified and tracked in our Buyer Insight Database.
FAQ – APPS RUN THE WORLD Top 10 Federal Government Software Vendors, Market Size & Forecast
Q1. What is the global Federal Government software market size in 2024?
A: The global Federal Government software market reached $9.8 billion in 2024, growing 14.7% year-over-year.
Q2. Who are the top 10 Federal Government software vendors in 2024, and what share do they hold?
A: The top 10 vendors include Microsoft, Palantir Technologies, SAP, Oracle, Zoom Video Communications, Tyler Technologies, Workday, ServiceNow, Google, and CGI Group, together holding 51.3% of the Federal Government market in 2024.
Q3. Which vendor leads the Federal Government software market in 2024?
A: Microsoft leads with approximately 26.7% market share in 2024.
Q4. What is the forecast for the Federal Government software market through 2029?
A: The market is expected to reach $13.0 billion by 2029, growing from $9.8 billion in 2024 at a 5.9% compound annual growth rate (CAGR).
Q5. What types of applications are included in the scope of the Federal Government software market in this report?
A: It includes systems for grants and performance management, computer-assisted dispatch, court management, tax collections, records management, financials, HR, and procurement.
Q6. What portion of the Federal Government software market is controlled by the top 10 vendors in 2024?
A: The top 10 vendors controlled 51.3% of the Federal Government software market in 2024.
Q7. When was this Federal Government report published and by whom?
A: The Top 10 Federal Government Software Vendors, Market Size & Forecast 2024-2029 report was published in July 2025 by APPS RUN THE WORLD analysts Albert Pang, Misho Markovski, and Marija Ristik, as part of the APPS TOP 500 research program, which benchmarks the revenues and market share of the world’s 1,500+ largest enterprise application vendors.
More Enterprise Applications Research Findings
Based on the latest annual survey of 10,000+ enterprise software vendors, Apps Run The World is releasing a number of dedicated reports, which profile the world’s 1,500 largest Enterprise Applications Vendors ranked by their 2024 product revenues. Their 2024 results are being broken down, sorted and ranked across 16 functional areas (from Analytics and BI to Treasury and Risk Management) and by 21 vertical industries (from Aerospace to Utility), as shown in our Taxonomy. Further breakdowns by subvertical, country, company size, etc. are available as custom data cuts per special request.
Research Methodology
Each year our global team of researchers conduct an annual survey of thousands of enterprise software vendors by contacting them directly on their latest quarterly and annual revenues by country, functional area, and vertical market.
We supplement their written responses with our own primary research to determine quarterly and yearly growth rates, In addition to customer wins to ascertain whether these are net new purchases or expansions of existing implementations.
Another dimension of our proactive research process is through continuous improvement of our customer database, which stores more than one million records on the enterprise software landscape of over 2 million organizations around the world.
The database provides customer insight and contextual information on what types of enterprise software systems and other relevant technologies are they running and their propensity to invest further with their current or new suppliers as part of their overall IT transformation projects to stay competitive, fend off threats from disruptive forces, or comply with internal mandates to improve overall enterprise efficiency.
The result is a combination of supply-side data and demand-generation customer insight that allows our clients to better position themselves in anticipation of the next wave that will reshape the enterprise software marketplace for years to come.
- Ocean Canyon Resorts, a United States based Leisure and Hospitality organization with 150 Employees
- Zoho, a India based Professional Services company with 19000 Employees
- Blackstone, a United States based Banking and Financial Services organization with 4895 Employees
| Logo | Company | Industry | Employees | Revenue | Country | Evaluated |
|---|
