

In 2024, the global Automotive software market grew to $17.9 billion, marking a 9.4% year-over-year increase. The top 10 vendors accounted for 51.6% of the total market. Cox Automotive led the pack with a 16.1% market share, followed by Microsoft, SAP, and CDK Global.
Through our forecast period, the Automotive applications market size is expected to reach $23.5 billion by 2029, compared with $17.9 billion in 2024 at a CAGR of 5.6%, as shown in the Apps Top 500 Report – Excel Edition [Preview] .
Automotive (Automotive production, equipment, repair, services) – PLM, CAD, CAM, Dealer Management System, Parts Management, Financials, HR, Procurement. Analytics could be the baseline for next-generation automobile apps not just for PLM to manufacture personalized cars, but also self-driving models that redefine transportation. Still supporting operations of global OEMs with unified systems will be top priority for apps vendors
Top 10 Automotive Software Vendors in 2024 and their Market Shares
Source: Apps Run The World, July 2025
Other Automotive software providers included in the report are: Adobe, ADP, Alfa Financial Software Holdings plc, Altair Engineering, Inc., Ansys Inc., Aptean, ARI Network, Atlassian, AVEVA Group, Bentley Systems Inc., Bynx, Cegedim, Blue Yonder, Cisco Systems, Citrix, CCC Intelligent Solutions, Constellation Software Inc., Descartes Systems Group, Exela Technologies, Inc., GE Digital, GEP Procurement, Google, Hexagon, IBM, IFS, Infor, Intuit Inc., LECTRA, LivePerson Inc., Manhattan Associates Inc., Oracle, Open Text Corporation, Palantir Technologies, PTC, QAD Inc., RingCentral, Roper Technologies, Inc., Sage, SAS Institute, ServiceNow, Shopify, SolarWinds, SupplyOn, Solera, Synopsys, Sofico, Salesforce.com, The Innovation Group, Trimble, UKG, Verizon Connect, Workday, Yonyou, Zoom Video Communications, and many others.
Vendor Snapshot: Automotive Market Leaders
 Cox Automotive
Cox Automotive’s vAuto Provision and Dealertrack DMS are leading solutions in the automotive retail sector, offering dealers advanced tools for inventory management, pricing, and dealership operations. vAuto Provision leverages live market data to assist dealers in appraising, pricing, and merchandising vehicles more efficiently, while Dealertrack DMS provides a cloud-based platform that integrates various dealership functions, enhancing operational efficiency and data connectivity.
Microsoft
Microsoft is deepening its presence in the automotive sector by integrating its Dynamics 365 suite across dealership finance, operations, and mobility ecosystems. OEMs and Tier 1 suppliers leverage Microsoft Azure to fast-track connected vehicle innovations, supporting real-time diagnostics, subscription services, and mobility solutions. The Dynamics 365 Automotive Accelerator offers a tailored data model and tools that help dealerships and OEMs enhance customer experience, streamline service operations, and automate marketing.
SAP
SAP S/4HANA, SAP Commerce Cloud, and SAP Ariba are widely adopted in the automotive industry to modernize ERP, digital commerce, and procurement processes, with OEMs and suppliers using them to streamline operations across global supply chains. S/4HANA leverages AI for predictive replenishment and order management; Commerce Cloud now includes generative AI features like visual search and auto-generated product content tailored for parts catalogs. SAP’s Joule Copilot and Business Data Cloud unify embedded AI across finance, supply chain, sales, and service functions, further reinforcing the company’s strong position among leading global automotive manufacturers.
CDK Global
CDK Global’s suite—encompassing CDK Dealership Xperience, CDK Global CRM, Autoline Drive DMS, CDK Drive, and IntelliDealer Financial Management—remains foundational to automotive retail, serving roughly 15,000 dealership locations across North America. Their platform integrates artificial intelligence via Neuron and the AIVA virtual assistant, enabling lead qualification, predictive equity mining, streamlined CRM engagement, and AI-driven service workflows and fixed‑ops support within the Dealership Xperience ecosystem.
Reynolds and Reynolds
Reynolds & Reynolds’ ERA-IGNITE and core DMS remain foundational to automotive dealership operations, offering integrated ERP, F&I, CRM, and service capabilities through a unified Retail Management System. In 2023 and early 2024, the company enhanced its platform by acquiring technology firms like AutoVision, embedding AI-driven tools for used-vehicle appraisal and inventory optimization directly into ERA-IGNITE.
Dassault Systemes
Dassault Systèmes’ 3DEXPERIENCE platform and CATIA remain essential in automotive R&D, design, and simulation, widely used by OEMs and suppliers to handle the complexity of EVs, ADAS, and modular vehicle architectures. These solutions support collaborative engineering and digital twin development, helping manufacturers accelerate design cycles and reduce time-to-market. In 2024–25, Dassault is investing in its Gen 7 AI-powered Virtual Twin ecosystem to address the advanced engineering demands of connected and autonomous vehicles.
Cadence Design Systems
Cadence plays a vital role in automotive structural simulation, crash analysis, and aerodynamics, supporting safety validation and regulatory compliance throughout the vehicle lifecycle. Its 2024 acquisition of BETA CAE Systems for $1.24 billion significantly expanded its footprint in automotive engineering, integrating advanced multiphysics tools into its portfolio. BETA CAE’s solutions, including ANSA and META, are widely embedded in digital workflows across major OEMs, enhancing Cadence’s position in end-to-end vehicle simulation.
Solera Holdings
Solera Holdings offers a comprehensive suite of automotive software solutions, including Omnitracs, DealerSocket Auto/Mate DMS, Spireon, DealerSocket CRM, Audatex, and Autodata, serving over 235,000 customers across more than 90 countries. These platforms span the entire vehicle lifecycle, encompassing fleet management, dealership operations, repair services, and data analytics. Solera’s strategic acquisitions, such as Omnitracs, DealerSocket, and Spireon, have integrated AI-powered capabilities, enhancing operational efficiency and data-driven decision-making across the automotive ecosystem.
Synopsys
Synopsys provides automotive software simulation and verification tools that address the complexities of software-defined vehicles and trends in electrification and autonomy. Its portfolio—including ANSYS Maxwell, LS-DYNA, EnSight, QTronic, and PikeTec—supports vehicle development, while recent acquisitions have expanded its capabilities in AI-powered safety, compliance, and software integration.
ARTW Technographics Platform: Automotive customer wins
Since 2010, our research team has been studying the patterns of the Automotive software purchases, analyzing customer behavior and vendor performance through continuous win/loss analysis. Updated quarterly, the ARTW Technographics Platform provides deep insights into thousands of Automotive customer wins and losses, helping users monitor competitive shifts, evaluate vendor momentum, and make informed go-to-market decisions.
List of Automotive customers
Source: ARTW Buyer Insights Technographic Database
Custom data cuts related to the Aerospace and Defense Applications market are available:
- Top 900+ Automotive Applications Vendors and Market Forecast 2024-2029
- 2024 Automotive Applications Market By Functional Market (16 Markets)
- 2024 Automotive Applications Market By Country (USA + 45 countries)
- 2024 Automotive Applications Market By Region (Americas, EMEA, APAC)
- 2024 Automotive Applications Market By Revenue Type (License, Services, Hardware, Support and Maintenance, Cloud)
- 2024 Automotive Applications Market By Customer Size (revenue, employee count, asset)
- 2024 Automotive Applications Market By Channel (Direct vs Indirect)
- 2024 Automotive Applications Market By Product
Worldwide Enterprise Applications by Vertical Market
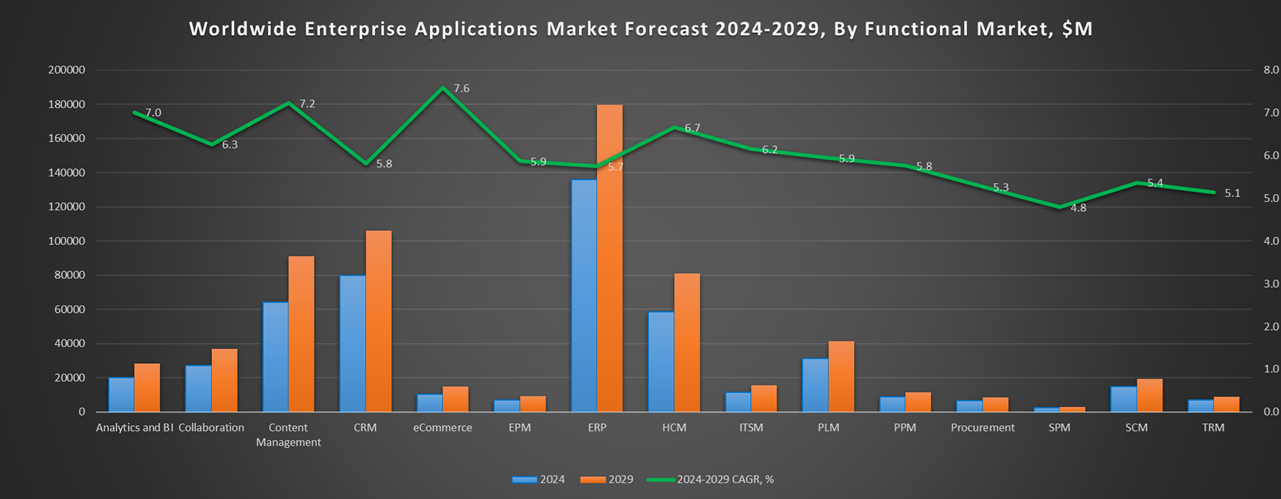
Exhibit 3 provides a forecast of the worldwide enterprise applications by vertical market from 2024 to 2029, highlighting market sizes, year-over-year growth, and compound annual growth rates across different industry sectors from Aerospace and Defense to Utilities.
Exhibit 3: Worldwide Enterprise Applications by Vertical Market Forecast 2024-2029 by Functional Market ($M)
Source: Apps Run The World, July 2025
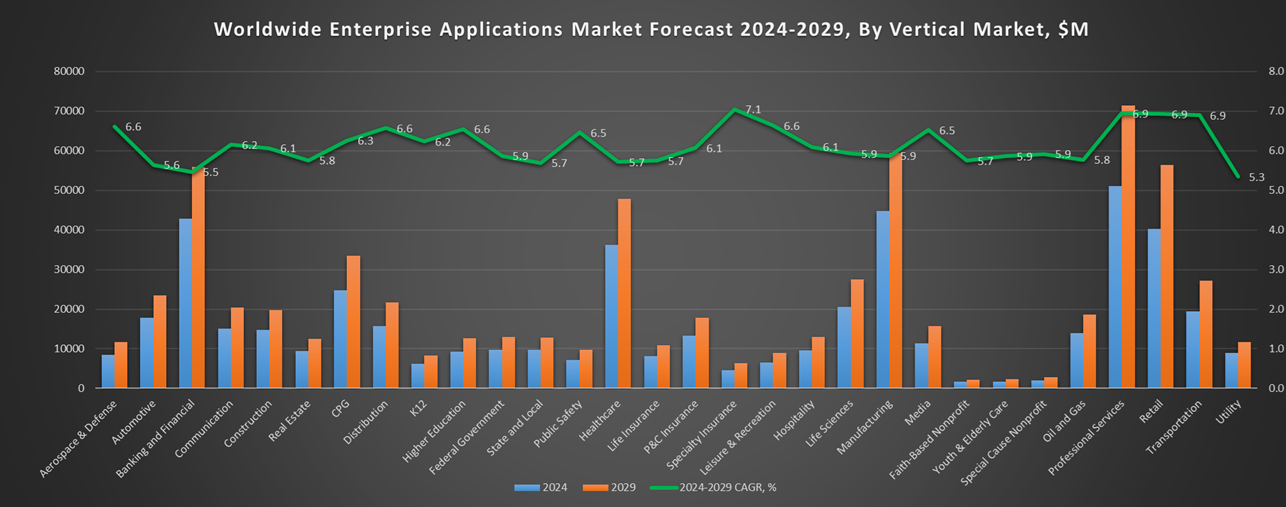
Exhibit 4 shows our projections for the enterprise applications market by vertical segment, based on the buying preferences and the customer propensity to invest in new software within those industries as they continue to upgrade and replace many legacy industry-specific applications that have been identified and tracked in our Buyer Insight Database.
FAQ – APPS RUN THE WORLD Top 10 Automotive Software Vendors, Market Size & Forecast
Q1. What is the global Automotive software market size in 2024?
The global Automotive software market was $17.9 billion in 2024, growing 9.4% year-over-year.
Q2. Who are the top 10 Automotive software vendors in 2024, and what share do they hold?
The top 10 vendors in 2024 are Cox Automotive, Microsoft, SAP, CDK Global, Reynolds & Reynolds, Dassault Systèmes, Cadence Design Systems, Solera Holdings, Synopsys, and PTC, together capturing 51.6% of the global Automotive software market.
Q3. Which vendor leads the Automotive software market in 2024?
Cox Automotive leads the market with a 16.1% share in 2024.
Q4. What is the forecast for the Automotive software market through 2029?
The market is projected to reach $23.5 billion by 2029, growing at a 5.6% compound annual growth rate (CAGR) from 2024.
Q5. What scope of software applications is included in the Automotive market in this report?
The report covers software for automotive production, equipment, repair, and services including PLM, CAD/CAM, Dealer Management Systems, parts management, financials, HR, procurement, and anticipates growth in analytics, autonomous driving, and personalized car software.
Q6. What portion of the Automotive software market does the top 10 control in 2024?
The top 10 vendors control 51.6% of the global Automotive software market in 2024.
Q7. When was this Automotive report published and by whom?
The Top 10 Automotive Software Vendors, Market Size & Forecast 2024–2029 report was published in July 2025 by APPS RUN THE WORLD analysts Albert Pang, Misho Markovski, and Marija Ristik, as part of the APPS TOP 500 research program, which benchmarks the revenues and market share of the world’s 1,500+ largest enterprise application vendors.
More Enterprise Applications Research Findings
Based on the latest annual survey of 10,000+ enterprise software vendors, Apps Run The World is releasing a number of dedicated reports, which profile the world’s 1,500 largest Enterprise Applications Vendors ranked by their 2024 product revenues. Their 2024 results are being broken down, sorted and ranked across 16 functional areas (from Analytics and BI to Treasury and Risk Management) and by 21 vertical industries (from Aerospace to Utility), as shown in our Taxonomy. Further breakdowns by subvertical, country, company size, etc. are available as custom data cuts per special request.
Research Methodology
Each year our global team of researchers conduct an annual survey of thousands of enterprise software vendors by contacting them directly on their latest quarterly and annual revenues by country, functional area, and vertical market.
We supplement their written responses with our own primary research to determine quarterly and yearly growth rates, In addition to customer wins to ascertain whether these are net new purchases or expansions of existing implementations.
Another dimension of our proactive research process is through continuous improvement of our customer database, which stores more than one million records on the enterprise software landscape of over 2 million organizations around the world.
The database provides customer insight and contextual information on what types of enterprise software systems and other relevant technologies are they running and their propensity to invest further with their current or new suppliers as part of their overall IT transformation projects to stay competitive, fend off threats from disruptive forces, or comply with internal mandates to improve overall enterprise efficiency.
The result is a combination of supply-side data and demand-generation customer insight that allows our clients to better position themselves in anticipation of the next wave that will reshape the enterprise software marketplace for years to come.
- Its Communications, a Japan based Communications organization with 692 Employees
- J.P. Morgan, a United States based Banking and Financial Services company with 4649 Employees
- Starr, a United States based Insurance organization with 350 Employees
| Logo | Company | Industry | Employees | Revenue | Country | Evaluated |
|---|
