
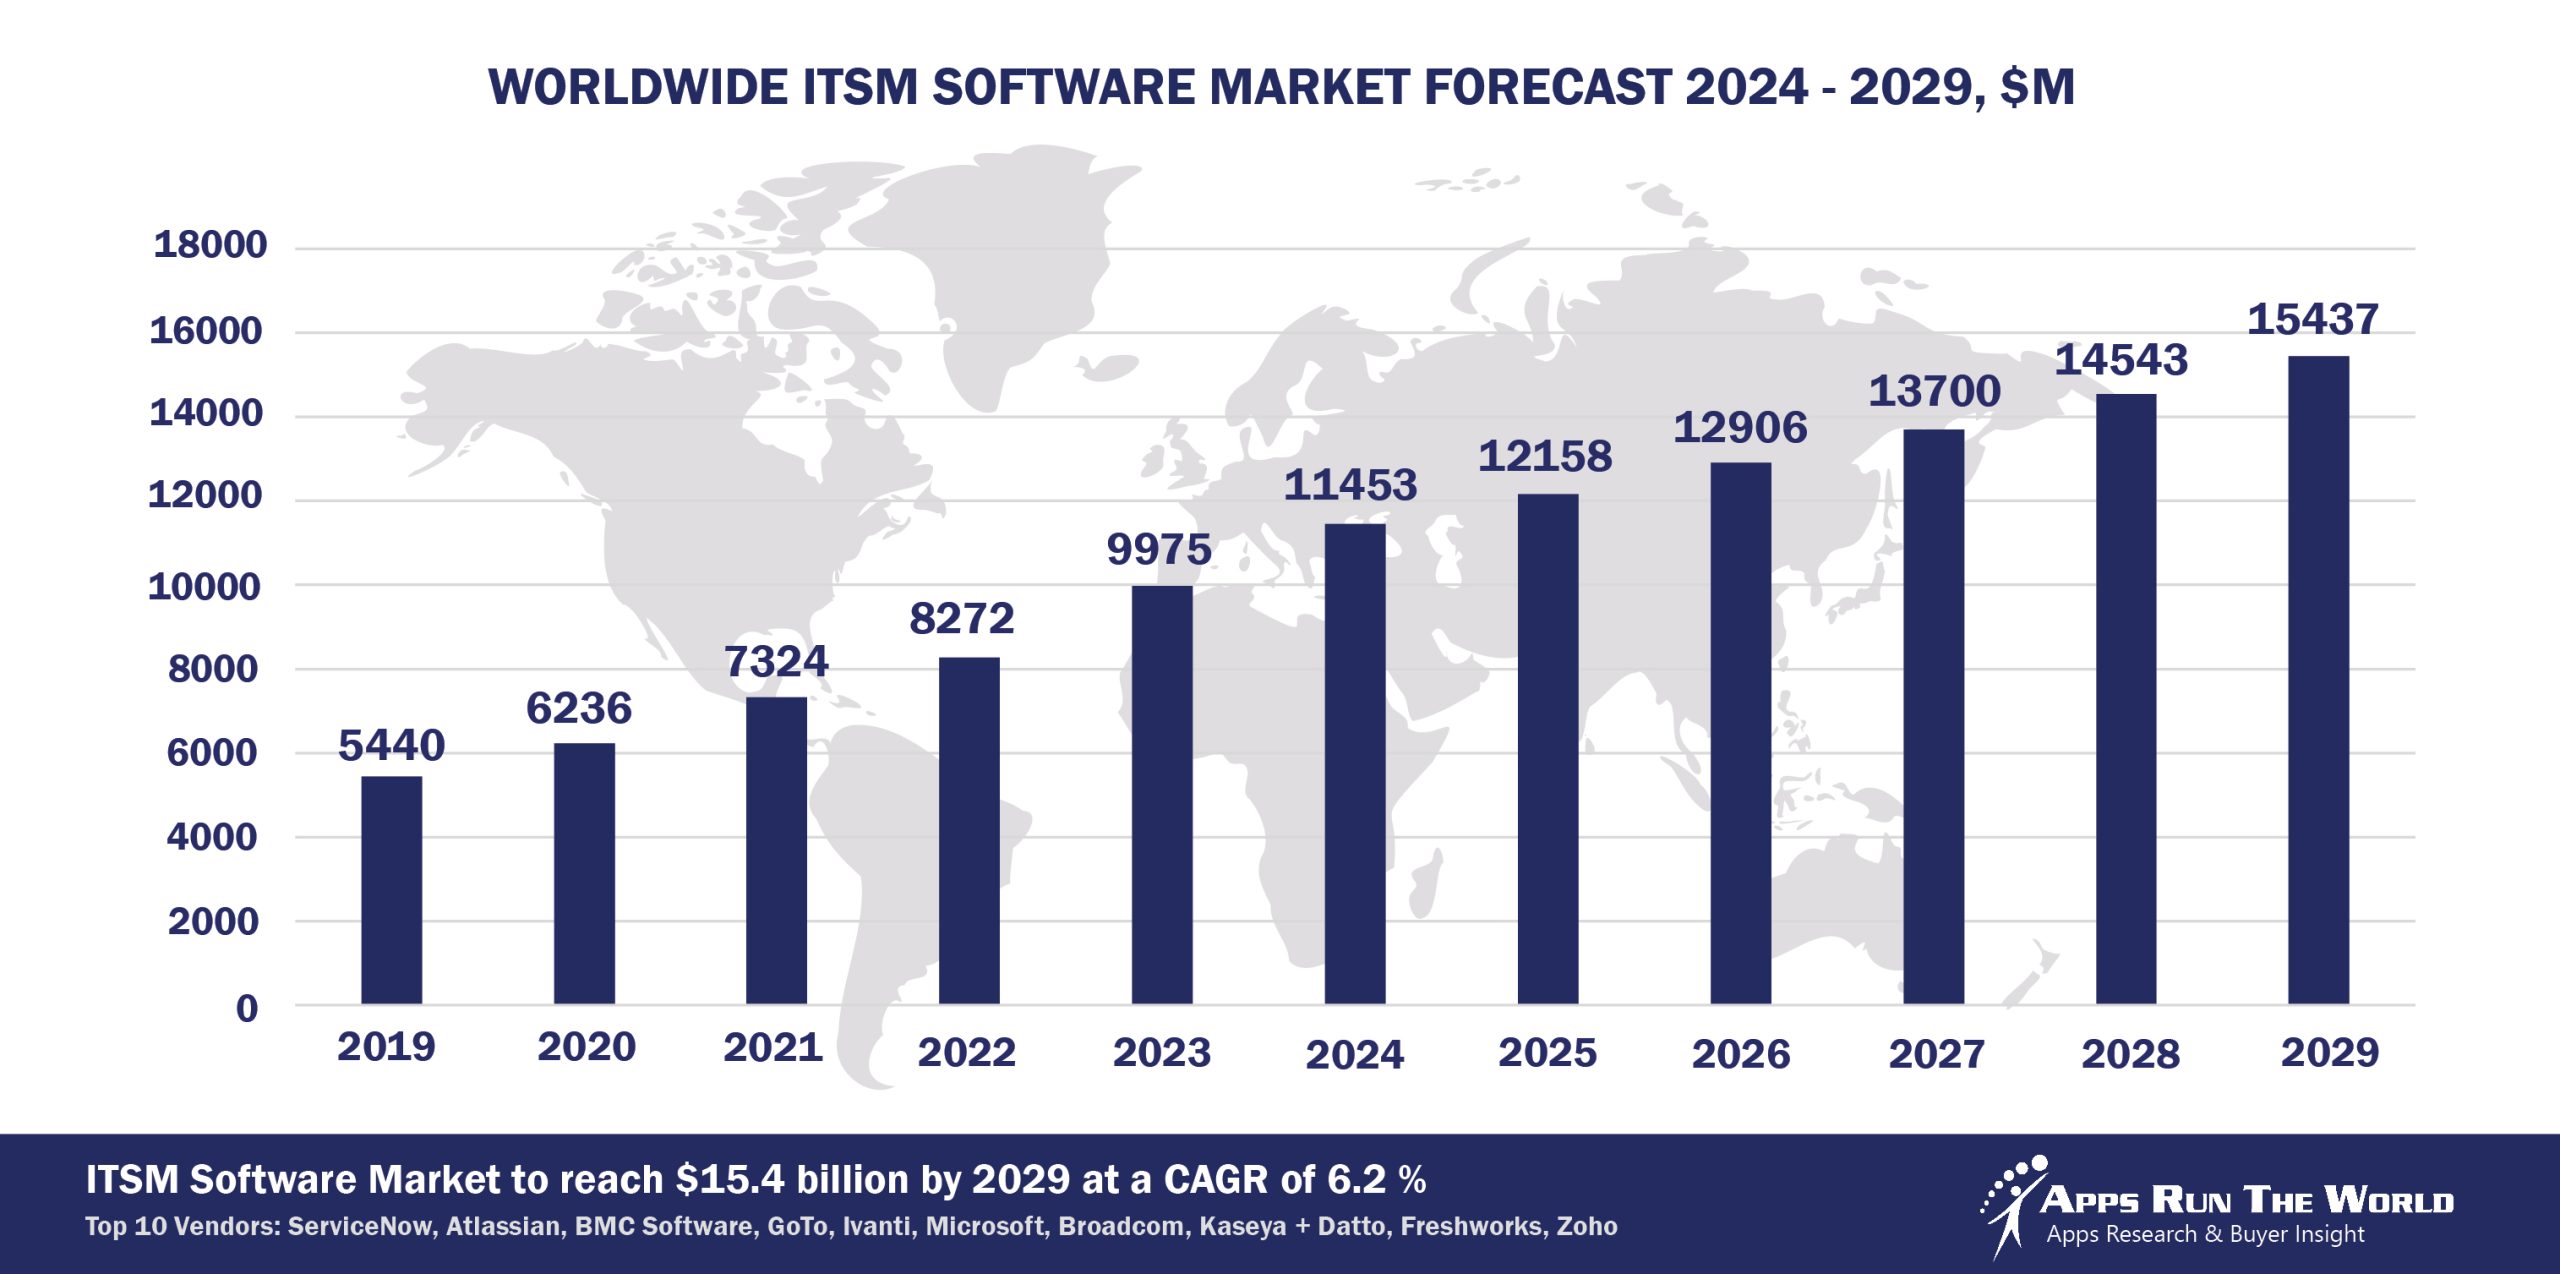
In 2024, the global IT Service Management software market grew to $11.4 billion, marking a 14.8% year-over-year increase. The top 10 vendors accounted for 83.3% of the total market. ServiceNow led the pack with a 44.4% market share, followed by Atlassian, BMC Software, GoTo, and Ivanti.
Through our forecast period, the IT Service Management applications market size is expected to reach $15.4 billion by 2029, compared with $11.5 billion in 2024 at a CAGR of 6.2%, as shown in the Apps Top 500 Report – Excel Edition [Preview] .
ITSM applications are being used to make a growing number of employee self-service functions possible through enterprise service management for asset, incident and project management. ITSM applications are considered a derivative market with revenue contribution to functional areas such as Project and Portfolio Management and Enterprise Resource Planning.
Top 10 IT Service Management Software Vendors in 2024 and their Market Shares
Source: Apps Run The World, July 2025
Other ITSM software providers included in the report are: Access Group, Alemba, Aranda Software, Aurea, Axway, Baidu, Cisco Systems, Citrix, DataOcean, EasyVista, Espressive, Freshworks (formerly Freshdesk), Liferay, Lumen Technologies, Open Text Corporation, Oracle, QuickBase, Roper Technologies, Inc., Rippling, SAP, Splunk, Sumo Logic, SolarWinds, SysAid Technologies, TeamDynamix, TIBCO Software Inc., TOPdesk, Yonyou and others.
Vendor Snapshot: IT Service Management Market Leaders
ServiceNow
ServiceNow is pioneering a transformative shift in ITSM by deeply embedding agentic AI and autonomous agents into its platform, positioning itself as the nerve center for autonomous IT operations. Its recent strategic acquisitions, including Moveworks, reinforce its AI-native roadmap focused on generative AI, conversational agents, and multi-agent orchestration. By enabling business users and IT architects to design complex workflows through intuitive low-code interfaces, ServiceNow empowers enterprises to achieve self-healing infrastructure, proactive incident prevention, and zero-touch service delivery. This holistic agentic ecosystem, combined with real-time analytics and customizable governance guardrails, cements its role as a market leader driving a future of autonomous IT delivery.
Atlassian
Atlassian intensifies its transition from traditional automation toward intelligent, agent-driven workflows that tightly integrate with its Jira Service Management. Its advancements center on AI agents that not only assist in incident triage and root cause analysis but also enable natural language orchestration across multiple communication channels, including collaboration platforms. By embedding low-code, agent-centric tools, Atlassian democratizes AI-powered service management, allowing non-developers to deploy sophisticated agent workflows spanning IT, HR, and employee services. This pragmatic, ROI-focused approach drives accelerated resolution cycles and reduced manual overhead, supporting its vision of agent-led, conversational IT service ecosystems.
BMC Software
BMC is evolving its ITSM suite toward a SaaS-first autonomous IT operations model, embedding intelligent agents that leverage predictive analytics and historical insights for incident resolution, change management, and asset lifecycle reconciliation. Its product roadmap features customizable agent templates and guided self-service flows that proactively detect risks and automate remediation. By converging agentic automation with stringent compliance workflows, BMC aims to minimize downtime and expedite change cycles while maintaining governance—a strategic pivot that underscores its commitment to delivering a fully autonomous IT loop in enterprise environments.
GoTo
GoTo is embedding agentic intelligence into its remote support and endpoint management solutions, focusing on autonomous detection and resolution of endpoint issues with minimal human intervention. Its recent innovations include conversational self-healing workflows and low-code orchestration that link AI agents to ticketing, remote access, and analytics platforms. This strategy caters primarily to SMB and mid-market segments by delivering scalable operational resilience and first-call resolution through autonomous support bots that dynamically escalate issues only when necessary, reflecting a move toward zero-touch IT support.
Ivanti
Ivanti is modernizing legacy ITSM platforms by integrating agentic frameworks that enable autonomous event-driven workflows and real-time device management based on telemetry data. Its roadmap highlights predictive incident agents powered by advanced analytics that trigger automated resolution pipelines. Through low-code conversational agent editors, Ivanti empowers business teams to design tailored AI-driven workflows embedded within service desks and asset management systems. Strategic integrations with analytics platforms amplify real-time intelligence, blending automation with robust governance for proactive IT service delivery.
Microsoft
Microsoft is advancing its ITSM offerings by integrating legacy system management tools with cloud-native orchestration and AI-powered automation through enhanced APIs connecting System Center Service Manager (SCSM) to Azure Monitor, Power Automate, and Microsoft Copilot-based support channels. This integration enables semi-autonomous incident routing and change workflows, empowering IT teams with Copilot-driven conversational support and AI-guided decision-making. By bridging legacy and cloud environments, Microsoft is facilitating smoother migrations while boosting operational efficiency—marking a strategic evolution toward agentic, AI-infused IT service management.
Broadcom
Broadcom reinforces its mature ITSM platform by embedding predictive analytics and automated SLA enforcement that dynamically reallocates support resources based on real-time service health insights. Its focus on algorithmic escalation workflows and advanced reporting enhances its ability to support large-scale enterprise environments with high-volume IT demands. These AI-driven capabilities position Broadcom CA Service Desk Manager as a robust solution that blends traditional ITSM strengths with emerging autonomous service delivery paradigms, ensuring responsiveness and operational stability.
Kaseya + Datto
The combined Kaseya and Datto platform bridges ITSM and remote monitoring with autonomous diagnostic agents that continuously monitor endpoints, triage incidents, and invoke self-healing actions. Their low-code orchestration interfaces empower IT teams to script conversational agent workflows that span ticketing, alerting, and remote management, creating an integrated autonomous lifecycle. This agentic model targets managed service providers and mid-market enterprises by delivering scalable, AI-driven IT support that reduces manual touchpoints and improves operational efficiency.
Freshworks
Freshworks accelerates its ITSM evolution by embedding agentic AI into Freshservice, its flagship ITSM platform, automating ticket triage, context-aware routing, and resolution suggestions using natural language processing and continuous agent feedback loops. The vendor’s platform upgrades emphasize conversational self-service bots and robust low-code editors that empower administrators to configure intelligent workflows rapidly. Freshworks positions Freshservice as a fast time-to-value ITSM solution, where autonomous analytics and guided support experiences continuously improve operational efficiency, making AI-driven automation central to its product roadmap and market differentiation.
ManageEngine (An Enterprise IT division of Zoho Corp)
ManageEngine is imbuing AI into its ITSM suite by championing chatbots that resolve routine tickets, trigger automated workflows, and escalate complex issues based on context. Its low-code virtual agent design environment allows administrators to develop conversational decision trees integrated with request fulfilment, service catalog, incident management, and knowledge base. The roadmap’s emphasis on autonomous analytics agents that predict incident surges and optimize resource allocation demonstrates ManageEngine’s commitment to evolving IT service management into a self-improving, lean AI-first operation suited for enterprises prioritizing efficiency and scalability.
ARTW Technographics Platform: IT Service Management customer wins
Since 2010, our research team has been studying the patterns of the IT Service Management software purchases, analyzing customer behavior and vendor performance through continuous win/loss analysis. Updated quarterly, the ARTW Technographics Platform provides deep insights into thousands of IT Service Management customer wins and losses, helping users monitor competitive shifts, evaluate vendor momentum, and make informed go-to-market decisions.
List of IT Service Management customers
Source: ARTW Buyer Insights Technographic Database
Custom data cuts related to the ITSM Applications market are available:
- Top 60+ ITSM Applications Vendors and Market Forecast 2024-2029
- 2024 ITSM Applications Market By Industry (21 Verticals)
- 2024 ITSM Applications Market By ITSM Segments and Categories
- 2024 ITSM Applications Market By Country (USA + 45 countries)
- 2024 ITSM Applications Market By Region (Americas, EMEA, APAC)
- 2024 ITSM Applications Market By Revenue Type (License, Services, Hardware, Support and Maintenance, Cloud)
- 2024 ITSM Applications Market By Customer Size (revenue, employee count, asset)
- 2024 ITSM Applications Market By Channel (Direct vs Indirect)
- 2024 ITSM Applications Market By Product
Worldwide Enterprise Application Market
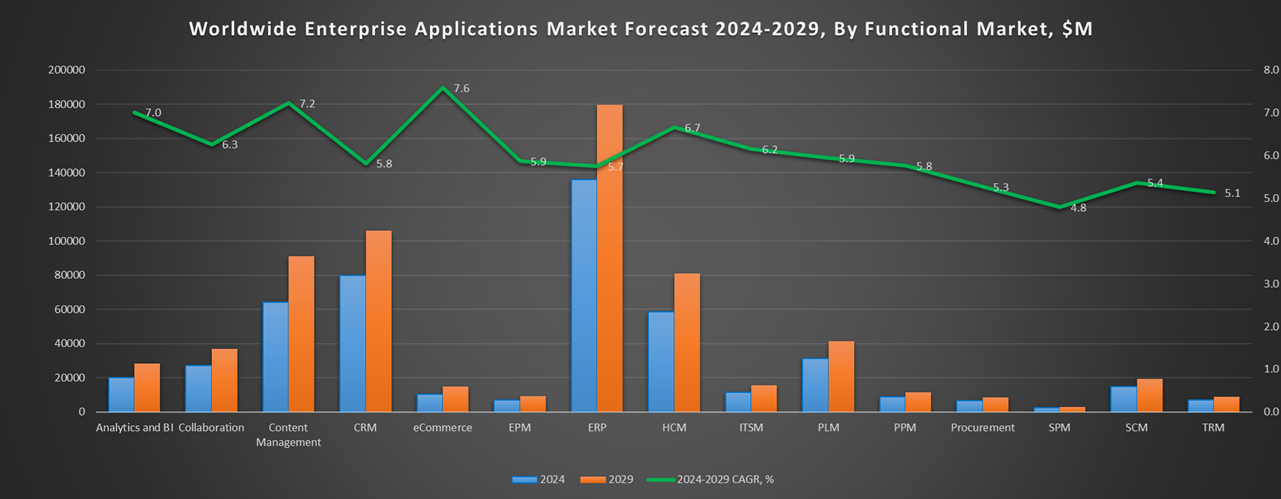
Exhibit 3 provides a forecast of the worldwide enterprise application market from 2024 to 2029, highlighting market sizes, year-over-year growth, and compound annual growth rates across various functional segments. The data shows strong growth in emerging areas like Content Management, eCommerce, Human Capital Management, and IT Service Management, while traditional segments like ERP and CRM continue to dominate in market size.
Exhibit 3: Worldwide Enterprise Application Market Forecast 2024-2029 by Functional Market, $M
Source: Apps Run The World, July 2025
Exhibit 4 shows the enterprise applications market by functional area. The highest growth functional markets revolve around smaller segments like Analytics and BI, eCommerce, Enterprise Performance Management, where first movers remain less established than those that for decades have been entrenched in functional areas like ERP, HCM, CRM and PLM.
FAQ – APPS RUN THE WORLD Top 10 IT Service Management Software Vendors, Market Size & Forecast
Q1. What is the global ITSM software market size in 2024?
A: The global IT Service Management software market was $11.4 billion in 2024, growing approximately 14.8% year-over-year.
Q2. What is the forecast for the ITSM market by 2029?
A: The ITSM applications market is expected to reach $15.4 billion by 2029, with a 6.2% compound annual growth rate (CAGR).
Q3. Who are the top 10 ITSM software vendors in 2024, and what share of the market do they hold?
A: The top 10 vendors, led by ServiceNow, Atlassian, BMC Software, GoTo, Ivanti, Microsoft, Broadcom, Kaseya + Datto, Freshworks, and Zoho (inc. ManageEngine), accounted for about 83.3% of the total ITSM market in 2024.
Q4. Which vendor leads the ITSM software market in 2024?
A: ServiceNow leads the ITSM market with a 44.4% market share in 2024.
Q5. What are some of the key use-cases or functions included in the ITSM market scope?
A: The report notes functions such as employee self-service, asset, incident, and project management, enterprise service management, and related services derived from ITSM.
Q6. Which vendors beyond the top 10 are mentioned in the ITSM market coverage?
A: Other included vendors are Access Group, Alemba, Aranda Software, Aurea, Axway, Baidu, Cisco, Citrix, DataOcean, EasyVista, Oracle, SAP, and several others.
Q7. When was this ITSM report published and by whom?
A: The Top 10 IT Service Management Software Vendors, Market Size & Forecast 2024-2029 report was published July 23, 2025 by APPS RUN THE WORLD analysts Albert Pang, Misho Markovski, and Marija Ristik, as part of the APPS TOP 500 research program, which benchmarks the revenues and market share of the world’s 1,500+ largest enterprise application vendors.
More Enterprise Applications Research Findings
Based on the latest annual survey of 10,000+ enterprise software vendors, Apps Run The World is releasing a number of dedicated reports, which profile the world’s 1,500 largest Enterprise Applications Vendors ranked by their 2024 product revenues. Their 2024 results are being broken down, sorted and ranked across 16 functional areas (from Analytics and BI to Treasury and Risk Management) and by 21 vertical industries (from Aerospace to Utility), as shown in our Taxonomy. Further breakdowns by subvertical, country, company size, etc. are available as custom data cuts per special request.
Research Methodology
Each year our global team of researchers conduct an annual survey of thousands of enterprise software vendors by contacting them directly on their latest quarterly and annual revenues by country, functional area, and vertical market.
We supplement their written responses with our own primary research to determine quarterly and yearly growth rates, In addition to customer wins to ascertain whether these are net new purchases or expansions of existing implementations.
Another dimension of our proactive research process is through continuous improvement of our customer database, which stores more than one million records on the enterprise software landscape of over 2 million organizations around the world.
The database provides customer insight and contextual information on what types of enterprise software systems and other relevant technologies are they running and their propensity to invest further with their current or new suppliers as part of their overall IT transformation projects to stay competitive, fend off threats from disruptive forces, or comply with internal mandates to improve overall enterprise efficiency.
The result is a combination of supply-side data and demand-generation customer insight that allows our clients to better position themselves in anticipation of the next wave that will reshape the enterprise software marketplace for years to come.
- PwC, a United Kingdom based Professional Services organization with 370000 Employees
- Sportcentrum Leeuwenbergh, a Netherlands based Leisure and Hospitality company with 370 Employees
- Saint Paul'S Baptist Church, a United States based Non Profit organization with 75 Employees
| Logo | Company | Industry | Employees | Revenue | Country | Evaluated |
|---|
