
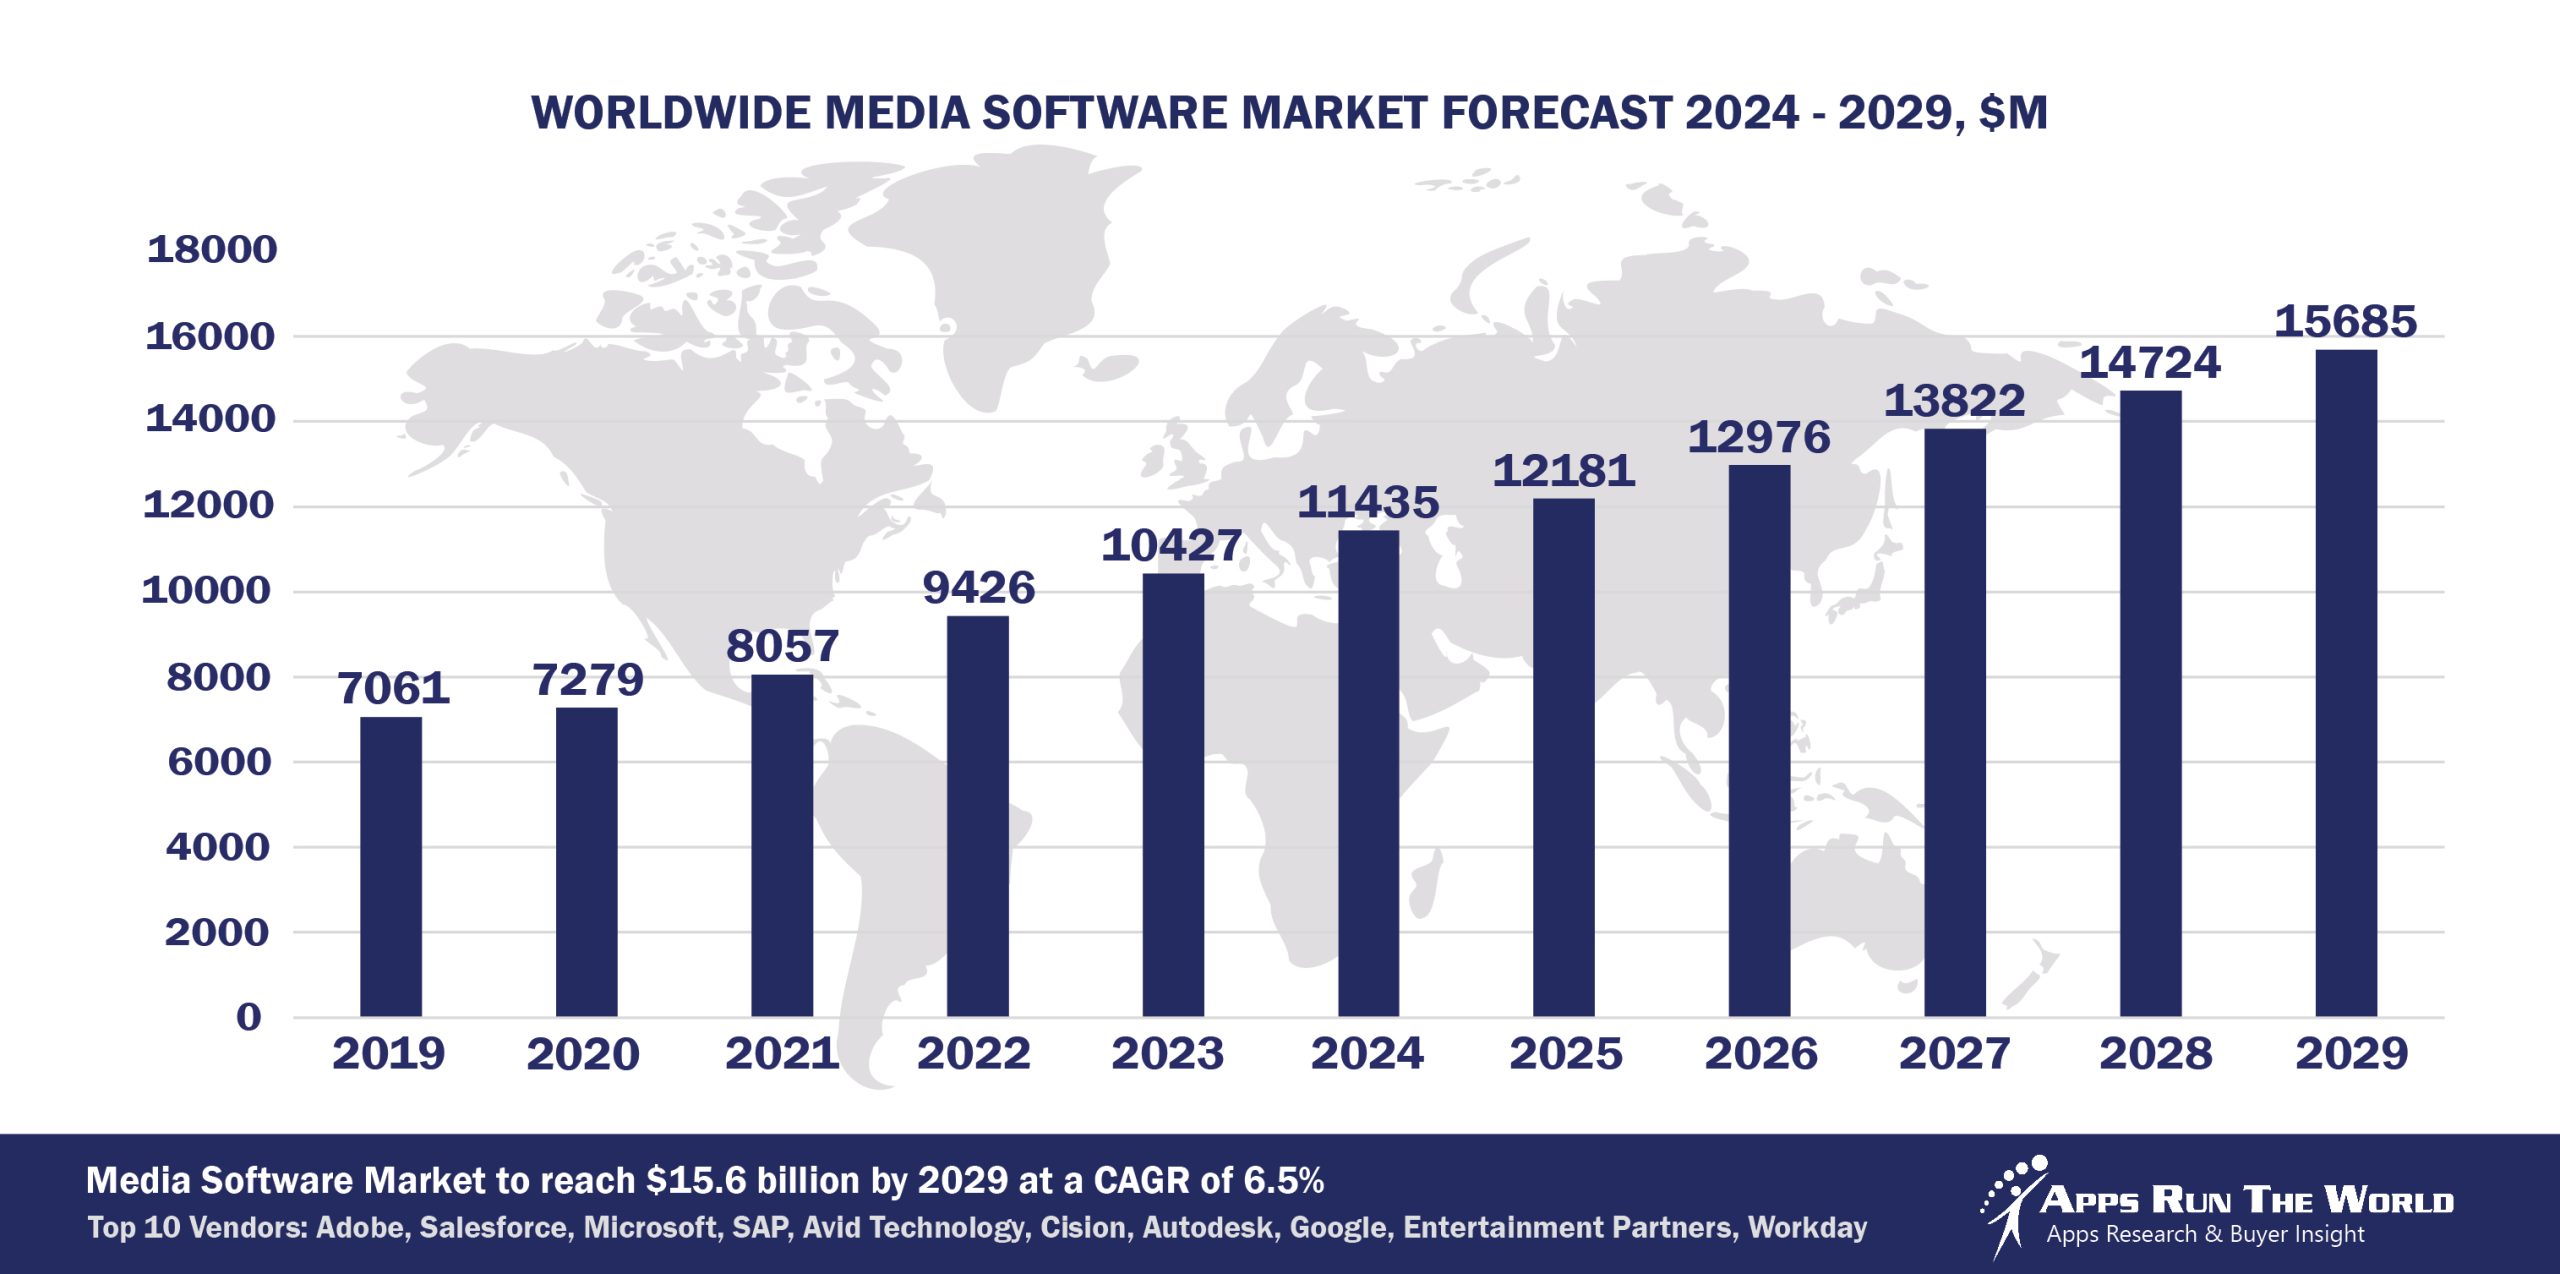
In 2024, the global Media software market grew to $6.5 billion, marking a 9.7% year-over-year increase. The top 10 vendors accounted for 50.3% of the total market. Adobe led the pack with a 13.1% market share, followed by Salesforce, Microsoft, and SAP.
Through our forecast period, the Media applications market size is expected to reach $15.7 billion by 2029, compared with $11.4 billion in 2024 at a CAGR of 6.5%, as shown in the Apps Top 500 Report – Excel Edition [Preview] .
Media & Entertainment (Content distribution, broadcasting, publishing, motion pictures) – Distribution resource management for publishing, content distribution; warehouse management system, supply chain management for publishing and content distribution, Media asset management (MAM); digital media infrastructure; digital asset management (DAM); Dynamic ticket pricing for live events, Broadcast resource management; equipment asset management; broadcast engineering and operations (E&O), FInancials, HR, Procurement
As online and mobile delivery becomes the norm across the media landscape, front-end investment to capture incremental and recurring revenues will become more important than ever. Tools for ad retargeting, audience development and subscription management are expected to fare well.
Top 10 Media Software Vendors in 2024 and their Market Shares
Source: Apps Run The World, July 2025
Other Media software providers included in the report are: Alteryx, Atlassian, Amazon Web Services (AWS), Arbeit Software, Asseco Group, Atex Media, Autodesk, Bazaarvoice, Constellation Software Inc., Cornerstone OnDemand, CSG Systems International, Dalet, Dropbox, Edgeverve, Egnyte, Eventbrite, Fiserv, Five9, Genesys, Google, Hansen Technologies, Hilan, HCL Technologies Ltd., Hyland, Infor, IBM, Intuit Inc., Khoros, Marin Software, Maropost, Magnite, MYOB, OmniSci, Oracle, Operative, Roper Technologies, Runrun.it, Sage, SAS Institute, ServiceNow, SETS, Sprinklr, Shopify, Squiz, SugarCRM, SurveyMonkey, Upwork, Vroozi, Workday, Zendesk, Zoho Corp., Zuora, Zoom Video Communications, and many other vendors.
Vendor Snapshot: Media Market Leaders
 Adobe
Adobe
Adobe’s Experience Platform now includes an Agent Orchestrator framework that supports orchestrated purpose‑built agents, like site optimization, content resizing, and audience refinement, working across Adobe and third‑party systems for seamless experience orchestration. Recent Summit announcements further advanced Firefly with vector/video generative capabilities, Firefly Boards for collaborative ideation, and tighter multimodal agent integrations across Photoshop, Express, and Premiere, laying the groundwork for AI‑driven, low‑code creative assistants that both guide and act on user intent.
Salesforce
The Agentforce platform, recently updated to version 2dx, introduces proactive, data‑triggered agents that operate in any workflow, supporting multimodal UI, prebuilt industry actions, and both low‑code and pro‑code configuration tools underscored by AgentBuilder for natural‑language agent definition. The most recent release, Agentforce 3, adds a command center for full observability and supports Model Context Protocol to ensure interoperability across agent systems, critical for managing agentic operations at enterprise scale. Strategic acquisitions like Convergence.ai bring adaptive task automation under the Agentforce umbrella, signaling that autonomous agents will underpin how media firms manage campaigns, service, and analytics workflows.
Microsoft
Microsoft’s media strategy is deeply integrated into Dynamics 365 and the broader Copilot ecosystem, turning media workflows into autonomous processes. The October 2024 launch of ten prebuilt autonomous agents in Dynamics, covering sales, service, supplier communication, etc., was followed by preview availability of Copilot Studio, enabling business users to configure custom agents grounded in organizational data and process maps. These agents support conversational interfaces via Microsoft 365 Copilot Chat and low‑code design surfaces, enabling zero‑engineer creation of tailored assistants, ideal for content operations, analytics, or customer service in media enterprises. Microsoft has also embedded autonomous service agents in Contact Center modules for media‑rich customer interactions.
SAP
SAP’s Generative AI Hub and Joule Agent framework support multi‑agent orchestration across ERP and analytics platforms, enabling planning, reasoning, coordination, and end‑to‑end execution without human intervention. SAP’s Business AI Innovation Lab initiative and educational investments like its Joule Agent Discovery Workshop aim to scale agentic design capabilities internally and among customers for media and marketing use cases. In media contexts, these agents can dynamically interpret campaign workflows, allocate budget, run analytics, and integrate audience insights across finance, marketing, and planning systems.
Avid Technology
Avid has quietly woven autonomous intelligence into its media‑production backbone. Recent R&D centers on embedding agents that recognize editing patterns (auto‑select candidate cuts, assemble rough timelines, flag revisions), effectively automating laborious editorial steps. Based on its existing AI‑powered workflows, Avid is moving toward multi‑agent orchestration, agents that analyze context, collaborate to assemble story edits, and free producers from repetitive tasks, forming a foundation for low‑code agent plug‑ins inside creative finishing pipelines.
Cision
CisionOne’s latest release introduces a built‑in AI Assistant plus intelligent workflow modules that automatically monitor news coverage, suggest tailor‑made pitches, surface journalist engagement science, and even trigger outreach campaigns, all via ambient agent dashboards and embedded conversational surfaces. Behind the scenes, agents continuously analyze engagement data, then autonomously schedule and execute action plans within communicators’ toolset, shifting PR from manual insight-hunting to hands‑off execution.
Autodesk
Adobe’s strategy in the Media industry is undergoing a decisive transformation as the company infuses agentic AI and intelligent automation deeply into its creative and content supply chain platforms. Rather than treating AI as a bolt-on, Adobe is embedding autonomous agents across its media stack to orchestrate everything from ideation and production to personalization and performance optimization. Its agentic approach is centered on enabling creative professionals and marketing teams to co-create with AI, not just automate tasks, blurring the line between human-led and machine-initiated workflows.
Google is aggressively weaving agentic AI into its Ads, Analytics, and Cloud platforms. Google’s “Marketing Advisor” agent in Chrome and Ads proactively suggests, implements, and troubleshoots targeting, creative layouts, and budgeting, acting more like an embedded partner than a passive tool, and is now rolling out conversational preview interfaces tied to Analytics trends and campaign health views. In parallel, Google Cloud is advancing its Agentspace and Agent‑to‑Agent protocols, launching toolkits to connect agents to BigQuery, deploy reasoning chains, and secure enterprise‑grade multi‑agent collaboration.
Entertainment Partners
Entertainment Partners is adapting its budgeting, scheduling, and production finance tools by incorporating agentic modules that can autonomously interpret cost data and forecast project adjustments. These agents are being trained to recommend budget reallocations, timeline optimizations, and risk remediation—automating places where human planners once dominated. Furthermore, partner engagements are introducing conversational interfaces and intelligent dashboards that operate like autonomous executive assistants, bridging production planning and financial workflows with minimal manual intervention.
Workday
Workday has architected media‑focused agentic AI around its new Agent System of Record and Agent Gateway. Workday now provides role‑based AI agents that autonomously monitor media budgets or talent contracts, flag anomalies, and execute workflows like approvals or reforecasting, all via conversational chat and low‑code configuration tools. The Agent System of Record gives enterprises centralized lifecycle governance, onboarding, metrics, cost tracking, and compliance across internal and third‑party agents.
ARTW Technographics Platform: Media customer wins
Since 2010, our research team has been studying the patterns of Media software purchases, analyzing customer behavior and vendor performance through continuous win/loss analysis. Updated quarterly, the ARTW Technographics Platform provides deep insights into thousands of Media customer wins and losses, helping users monitor competitive shifts, evaluate vendor momentum, and make informed go-to-market decisions.
List of Media customers
Source: ARTW Buyer Insights Technographic Database
Custom data cuts related to the Media Applications market are available:
- Top 850+ Media Applications Vendors and Market Forecast 2024-2029
- 2024 Media Applications Market By Functional Market (16 Markets)
- 2024 Media Applications Market By Country (USA + 45 countries)
- 2024 Media Applications Market By Region (Americas, EMEA, APAC)
- 2024 Media Applications Market By Revenue Type (License, Services, Hardware, Support and Maintenance, Cloud)
- 2024 Media Applications Market By Customer Size (revenue, employee count, asset)
- 2024 Media Applications Market By Channel (Direct vs Indirect)
- 2024 Media Applications Market By Product
Worldwide Enterprise Applications by Vertical Market
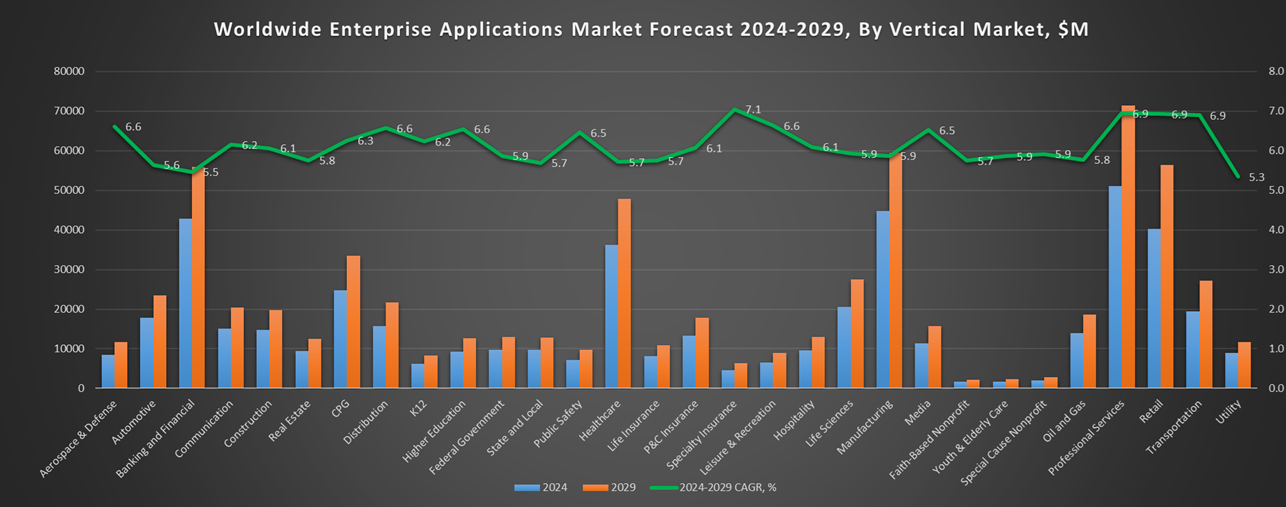
Exhibit 3 provides a forecast of the worldwide enterprise applications by vertical market from 2024 to 2029, highlighting market sizes, year-over-year growth, and compound annual growth rates across different industry sectors from Aerospace and Defense to Utilities.
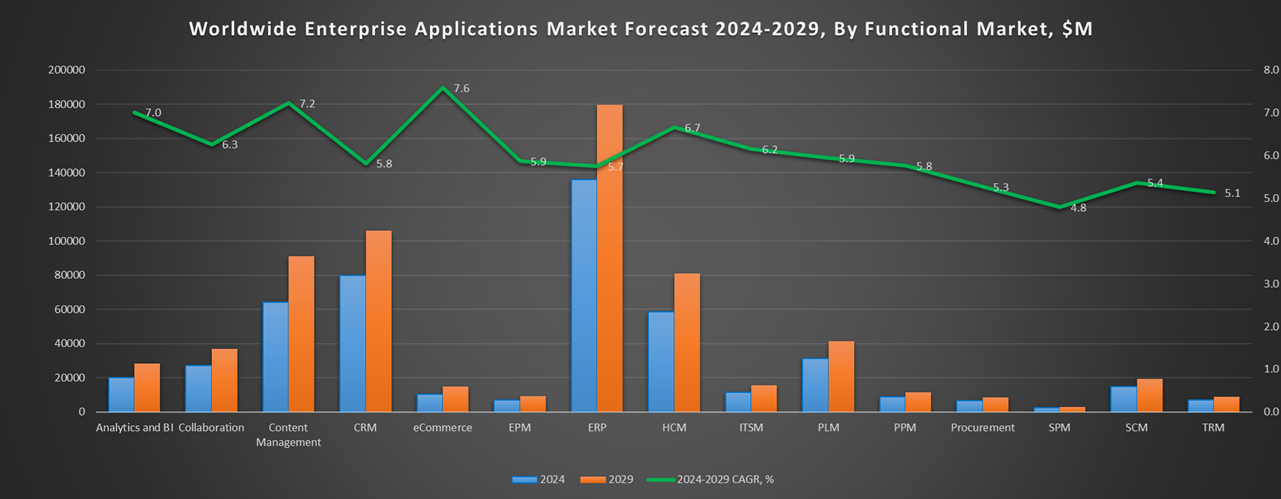
Exhibit 3: Worldwide Enterprise Applications by Vertical Market Forecast 2024-2029 by Functional Market ($M)
Source: Apps Run The World, July 2025
Exhibit 4 shows our projections for the enterprise applications market by vertical segment, based on the buying preferences and the customer propensity to invest in new software within those industries as they continue to upgrade and replace many legacy industry-specific applications that have been identified and tracked in our Buyer Insight Database.
FAQ – APPS RUN THE WORLD Top 10 Media Software Vendors, Market Size & Forecast
Q1. What is the global Media software market size in 2024?
A: The global Media software market reached $7.7 billion in 2024, reflecting strong demand for content management, streaming technologies, and digital media transformation.
Q2. Who are the top 10 Media software vendors in 2024 and their combined share?
A: The top 10 Media software vendors are Oracle, Adobe, Salesforce, SAP, Avid Technology, Salesforce/Vlocity, IBM, Microsoft, CSG, and Imagine Communications, collectively capturing a significant portion of the global market.
Q3. Which vendor leads the Media software market in 2024?
A: Oracle leads the Media software market in 2024, supported by a comprehensive portfolio spanning content distribution, advertising, and customer engagement tools.
Q4. How does this report define the Media software market scope?
A: The Media software market includes applications for publishing, broadcasting, streaming, advertising management, content rights, and subscriber analytics for digital media providers.
Q5. What is the Media software market outlook through 2029?
A: The Media software market is expected to reach nearly $10 billion by 2029, driven by the growth of OTT platforms, cloud-native media workflows, and AI-based personalization.
Q6. Which other Media software vendors are covered beyond the top 10?
A: The report also covers vendors like Brightcove, WideOrbit, Dalet, Amagi, Comcast Technology Solutions, and SintecMedia, among many others.
Q7. When was this report published and by whom?
A: The Top 10 Media Software Vendors, Market Size and Forecast 2024–2029 was published July 23, 2025 by APPS RUN THE WORLD analysts Albert Pang, Misho Markovski, and Marija Ristik, as part of the APPS TOP 500 research program, which benchmarks the revenues and market share of the world’s 1,500+ largest enterprise application vendors.
More Enterprise Applications Research Findings
Based on the latest annual survey of 10,000+ enterprise software vendors, Apps Run The World is releasing a number of dedicated reports, which profile the world’s 1,500 largest Enterprise Applications Vendors ranked by their 2024 product revenues. Their 2024 results are being broken down, sorted and ranked across 16 functional areas (from Analytics and BI to Treasury and Risk Management) and by 21 vertical industries (from Aerospace to Utility), as shown in our Taxonomy. Further breakdowns by subvertical, country, company size, etc. are available as custom data cuts per special request.
Research Methodology
Each year our global team of researchers conduct an annual survey of thousands of enterprise software vendors by contacting them directly on their latest quarterly and annual revenues by country, functional area, and vertical market.
We supplement their written responses with our own primary research to determine quarterly and yearly growth rates, In addition to customer wins to ascertain whether these are net new purchases or expansions of existing implementations.
Another dimension of our proactive research process is through continuous improvement of our customer database, which stores more than one million records on the enterprise software landscape of over 2 million organizations around the world.
The database provides customer insight and contextual information on what types of enterprise software systems and other relevant technologies are they running and their propensity to invest further with their current or new suppliers as part of their overall IT transformation projects to stay competitive, fend off threats from disruptive forces, or comply with internal mandates to improve overall enterprise efficiency.
The result is a combination of supply-side data and demand-generation customer insight that allows our clients to better position themselves in anticipation of the next wave that will reshape the enterprise software marketplace for years to come.
- Dp Fox Holdings, a United States based Banking and Financial Services organization with 10 Employees
- Graphics Arts Solution, a United States based Professional Services company with 50 Employees
- Essec Asia Center In Singapore, a Singapore based Professional Services organization with 10 Employees
| Logo | Company | Industry | Employees | Revenue | Country | Evaluated |
|---|
