
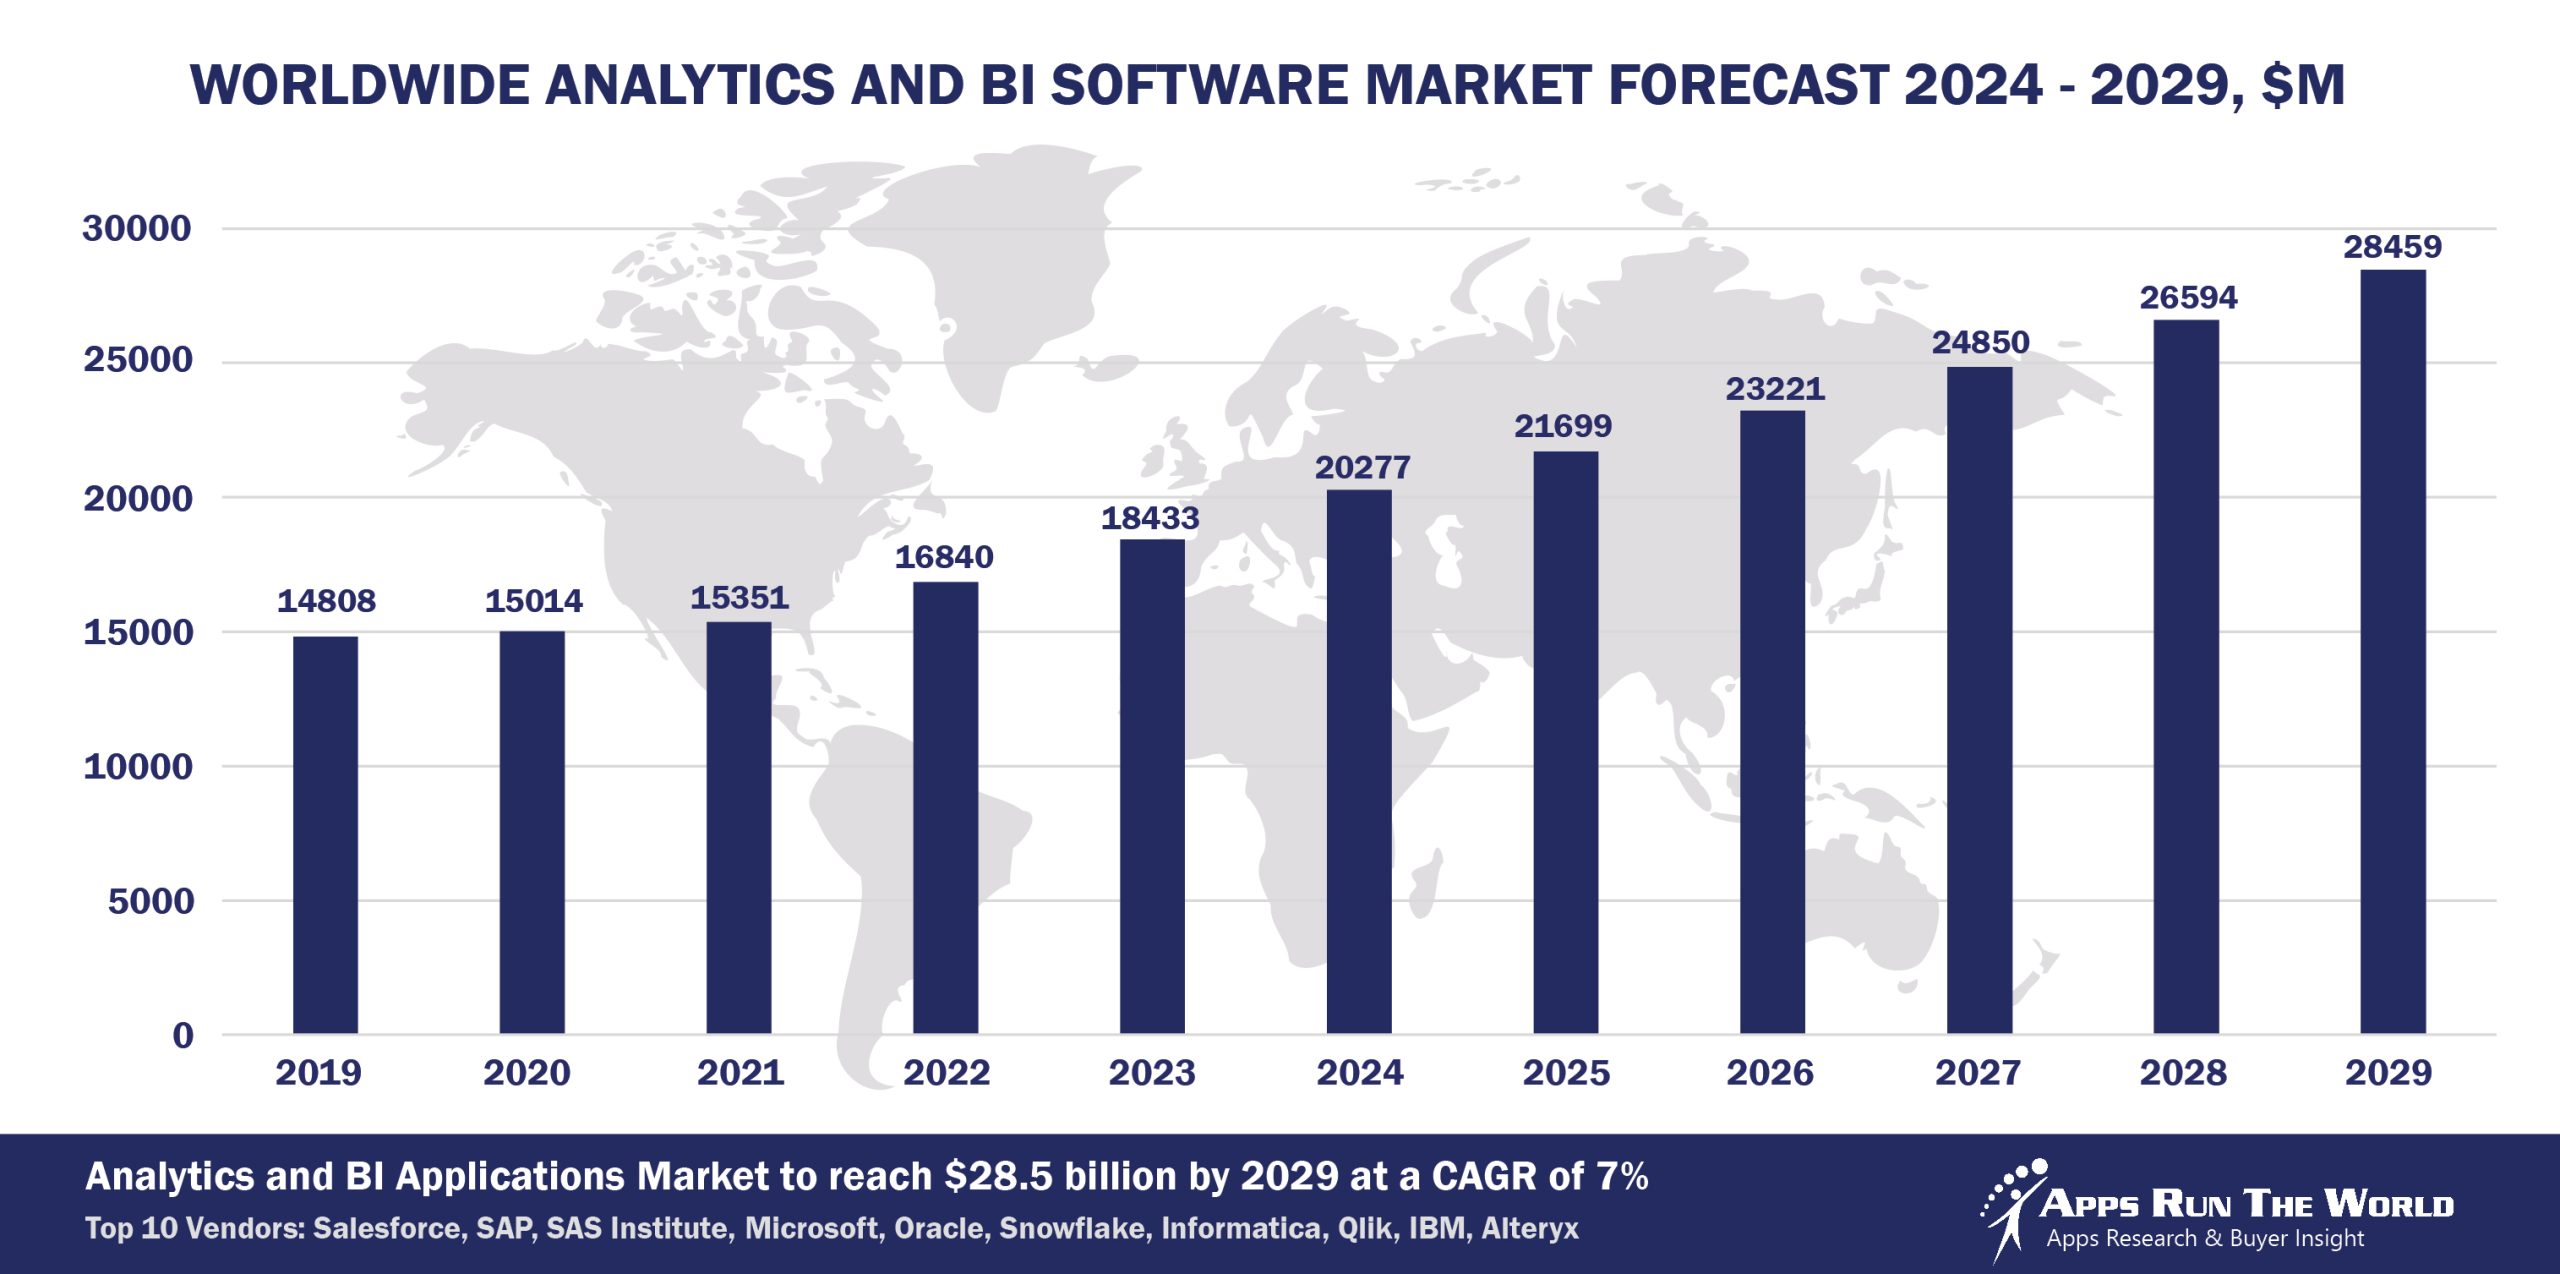
In 2024, the global Analytics and Business Intelligence (BI) software market grew to $20.3 billion, marking a 10% year-over-year increase. The top 10 vendors accounted for 64.1% of the total market. Salesforce with Tableau led the pack with a 14.8% market share, followed by SAP, SAS Institute, Microsoft, and Oracle.
Through our forecast period, the Analytics and BI applications market size is expected to reach $28.5 billion by 2029, compared with $20.3 billion in 2024 at a CAGR of 7%, as shown in the Apps Top 500 Report – Excel Edition [Preview] .
Analytics applications cover business intelligence functions sold as a standalone application package for decision support or embedded in an integrated solution for functions such as revenue performance or for specific verticals such as healthcare performance management.
Top 10 Analytics and BI Software Vendors in 2024 and their Market Shares
Source: Apps Run The World, July 2025
Other Analytics and BI software providers included in the report are: Adobe, Amazon Web Services, Appian, Board, Datameer, Domo, Celonis, Constellation Software, Domo, FIS Global, Fujitsu, GoodData, Google, Infor, IQVIA, MedeAnalytics, Microstrategy, Nintex, OmniSci, Panorama Software, Pyramid Analytics, Rosslyn Data Technologies, Sage, Snowflake, Sisense, SplashBI, Tango Analytics, ThoughtSpot, TIBCO, TOTVS, Verisk Analytics, Webtrends, Wolters Kluwer, Yellowfin BI, and many others.
Vendor Snapshot: Analytics and BI Market Leaders
![]()
Salesforce
Salesforce now anchors its analytics and BI capabilities around Tableau and the Data Cloud, while driving agentic AI through its Agentforce platform. Agentforce enables AI agents to autonomously execute tasks—from customer service to sales coaching—using enterprise data. Salesforce’s $8 billion acquisition of Informatica (closing early in fiscal 2027) is a strategic move to unify powerful data management, governance, and metadata with its agent platform, enabling a seamless architecture for large-scale, autonomous data-driven workflows.
SAP
SAP tightly blends analytics and agents via its Analytics Cloud, Business Data Cloud, and AI Agent Hub. Its Joule Agents, built on deep business-process context and SAP’s Knowledge Graph, can autonomously execute multi-step workflows within finance, supply chain, and HR. These intelligent agents integrate natively with analytics, planning, and predictive modeling, supporting no-code agent building and governed generative AI across enterprise operations.
SAS
SAS Viya has evolved into a unified analytics and agentic AI platform. At SAS Innovate 2025, the company unveiled AI agents in its decision‑intelligence framework—complete with auditability, bias checks, and governance—plus Viya Copilot, Data Maker and improved Workbench for model-building. These agents can drive analytics workflows autonomously, while maintaining regulatory trust across healthcare, manufacturing, and finance use cases.
Microsoft
Microsoft integrates agentic AI into its analytics stack via Power BI, Fabric, and Copilot Studio. Its newly announced Fabric Data Agents use OneLake to access unified data from hundreds of sources. Users can ask questions conversationally, receive AI-powered insights, and trigger downstream analytics or workflows—while maintaining enterprise governance, compliance, and customization through Copilot APIs.
Oracle
Oracle offers a broad analytics portfolio centered around Oracle Analytics Cloud (OAC), part of its larger Fusion Data Intelligence Platform. With built-in machine learning, natural language processing, and strong data governance, OAC enables organizations to uncover insights across financials, HR, supply chain, and customer experience. Oracle’s analytics capabilities are tightly integrated with its SaaS applications and OCI infrastructure, providing a unified experience for enterprise-wide data exploration and decision-making.
Snowflake
Snowflake positions itself at the intersection of BI and agentic AI through its new Snowflake Intelligence platform. It introduces Cortex Agents—purpose‑built AI agents delivering reasoning, planning, and action across structured and unstructured data. Data Science Agent (private preview) automates full ML pipeline generation from natural language prompts. These agents enable business users and data scientists to interact with, analyze, and act upon enterprise data autonomously—with trust, governance, and integrated visualization.
Informatica
While primarily a leader in data integration and governance via IDMC and its CLAIRE AI engine, Informatica is now central to Salesforce’s agentic AI architecture following the upcoming acquisition. Its robust metadata, cleansing, master-data, and integration capabilities will power trusted data foundations for agents executing analytics and business automation workflows.
Qlik
Qlik has introduced a full agentic experience within Qlik Cloud, centered on conversational analytics via Qlik Answers™ and specialized AI agents (discovery, pipeline, predictive, automation, productivity). These agents help users discover anomalies, design pipelines, build predictive models, and take action—all through a unified analytics engine that supports both structured and unstructured data.
IBM
IBM brings agentic AI to BI through watsonx BI Assistant, which allows users to ask natural-language questions and receive actionable explanations, predictions, and next-step recommendations. It integrates with Cognos Analytics, features governed metrics catalogs, alerting, and embedded collaboration in Slack/Teams—enabling an AI agent that acts as a business analyst/advisor with full transparency and governance.
Alteryx
Alteryx remains a leader in low-code/no-code analytics workflows with Designer and Alteryx Analytics Cloud. It emphasizes automation, reproducibility, and integration with Python/R. Though it doesn’t offer full agentic AI platforms, it’s advancing the inclusion of AI “guided assistants” and workflow automation that prepare the ground for more autonomous analytics capabilities.
ARTW Technographics Platform: Analytics and BI customer wins
Since 2010, our research team has been studying the patterns of the Analytics and BI software purchases, analyzing customer behavior and vendor performance through continuous win/loss analysis. Updated quarterly, the ARTW Technographics Platform provides deep insights into thousands of Analytics and BI customer wins and losses, helping users monitor competitive shifts, evaluate vendor momentum, and make informed go-to-market decisions.
List of Analytics and BI customers
Source: ARTW Buyer Insights Technographic Database
Custom data cuts related to the Analytics and BI Applications market are available:
- Top 300+ Analytics and BI Applications Vendors and Market Forecast 2024-2029
- 2024 Analytics and BI Applications Market By Industry (21 Verticals)
- 2024 Analytics and BI Applications Market By Analytics and BI Segments and Categories
- 2024 Analytics and BI Applications Market By Country (USA + 45 countries)
- 2024 Analytics and BI Applications Market By Region (Americas, EMEA, APAC)
- 2024 Analytics and BI Applications Market By Revenue Type (License, Services, Hardware, Support and Maintenance, Cloud)
- 2024 Analytics and BI Applications Market By Customer Size (revenue, employee count, asset)
- 2024 Analytics and BI Applications Market By Channel (Direct vs Indirect)
- 2024 Analytics and BI Applications Market By Product
Worldwide Enterprise Application Market
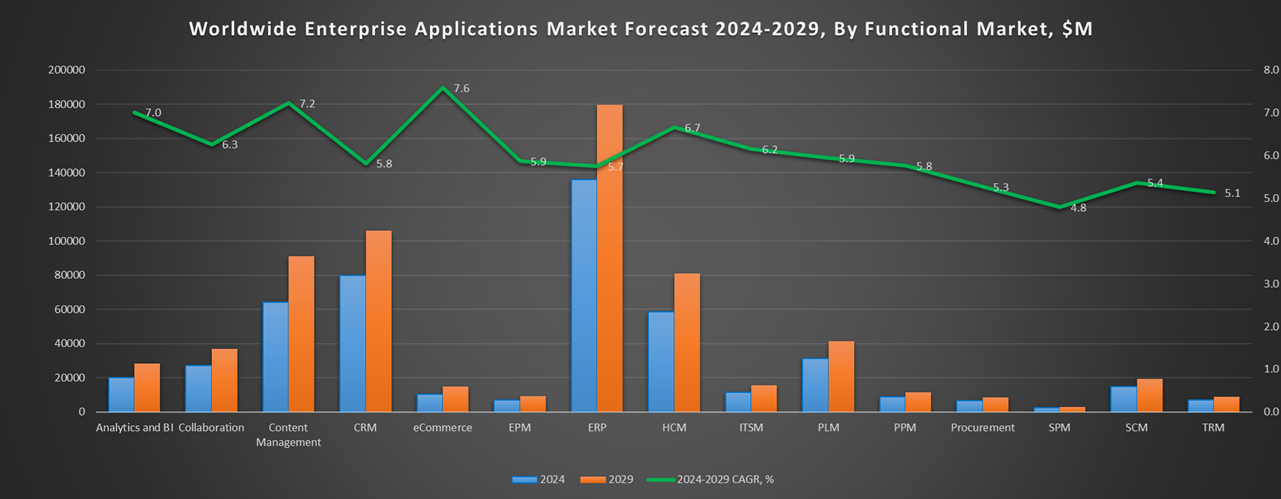
Exhibit 3 provides a forecast of the worldwide enterprise application market from 2024 to 2029, highlighting market sizes, year-over-year growth, and compound annual growth rates across various functional segments. The data shows strong growth in emerging areas like Content Management, eCommerce, Human Capital Management, and IT Service Management, while traditional segments like ERP and CRM continue to dominate in market size.
Exhibit 3: Worldwide Enterprise Application Market Forecast 2024-2029 by Functional Market, $M
Source: Apps Run The World, July 2025
Exhibit 4 shows the enterprise applications market by functional area. The highest growth functional markets revolve around smaller segments like Analytics and BI, eCommerce, Enterprise Performance Management, where first movers remain less established than those that for decades have been entrenched in functional areas like ERP, HCM, CRM and PLM.
FAQ – APPS RUN THE WORLD Top 10 Analytics & BI Software Vendors, Market Size & Forecast
Q1. What is the global Analytics & BI software market size in 2024?
A: The global Analytics & BI software market was $20.3 billion in 2024, growing about 10% year‑over‑year thanks to rising demand for data‑driven decision tools and cloud‑based analytics.
Q2. Who are the top Analytics & BI vendors in 2024 and their combined market share?
A: The leading vendors in 2024 include Salesforce (with Tableau), SAP, SAS Institute, Microsoft, Oracle, Snowflake, Informatica, Qlik, IBM, and Alteryx, which together account for 64.1% of the total Analytics & BI market.
Q3. Which vendor leads the Analytics & BI market in 2024?
A: Salesforce (with Tableau) leads the Analytics & BI market in 2024 with approximately 14.8% market share.
Q4. What is the forecast for the Analytics & BI market through 2029?
A: The Analytics & BI market is expected to reach $28.5 billion by 2029, growing at a compound annual growth rate (CAGR) of 7% from 2024.
Q5. What is included in the scope of Analytics & BI applications in this report?
A: The report covers standalone business intelligence and analytics tools, embedded analytics for decision support, and vertical use cases such as healthcare performance and revenue optimization.
Q6. Which other Analytics & BI vendors are covered beyond the top 10?
A: The report also profiles additional Analytics & BI vendors such as ThoughtSpot, Sisense, Yellowfin, Domo, GoodData, Looker, and others serving niche or mid‑market segments.
Q7. When was the Analytics & BI report published and by whom?
A: The Top 10 Analytics & BI Software Vendors, Market Size and Forecast 2024‑2029 report was published July 2025 by APPS RUN THE WORLD as part of the APPS TOP 500 research program, which benchmarks the revenues and market share of the world’s 1,500+ largest enterprise applications vendors.
More Enterprise Applications Research Findings
Based on the latest annual survey of 10,000+ enterprise software vendors, Apps Run The World is releasing a number of dedicated reports, which profile the world’s 1,500 largest Enterprise Applications Vendors ranked by their 2024 product revenues. Their 2024 results are being broken down, sorted and ranked across 16 functional areas (from Analytics and BI to Treasury and Risk Management) and by 21 vertical industries (from Aerospace to Utility), as shown in our Taxonomy. Further breakdowns by subvertical, country, company size, etc. are available as custom data cuts per special request.
Research Methodology
Each year our global team of researchers conduct an annual survey of thousands of enterprise software vendors by contacting them directly on their latest quarterly and annual revenues by country, functional area, and vertical market.
We supplement their written responses with our own primary research to determine quarterly and yearly growth rates, in addition to customer wins to ascertain whether these are net new purchases or expansions of existing implementations.
Another dimension of our proactive research process is through continuous improvement of our customer database, which stores more than one million records on the enterprise software landscape of over 2 million organizations around the world.
The database provides customer insight and contextual information on what types of enterprise software systems and other relevant technologies they are running and their propensity to invest further with their current or new suppliers as part of their overall IT transformation projects to stay competitive, fend off threats from disruptive forces, or comply with internal mandates to improve overall enterprise efficiency.
The result is a combination of supply-side data and demand-generation customer insight that allows our clients to better position themselves in anticipation of the next wave that will reshape the enterprise software marketplace for years to come.
- AMD, a United States based Manufacturing organization with 28000 Employees
- Pipl, a United States based Communications company with 25 Employees
- Cfo Shortlist, a United States based Professional Services organization with 10 Employees
| Logo | Company | Industry | Employees | Revenue | Country | Evaluated |
|---|
