
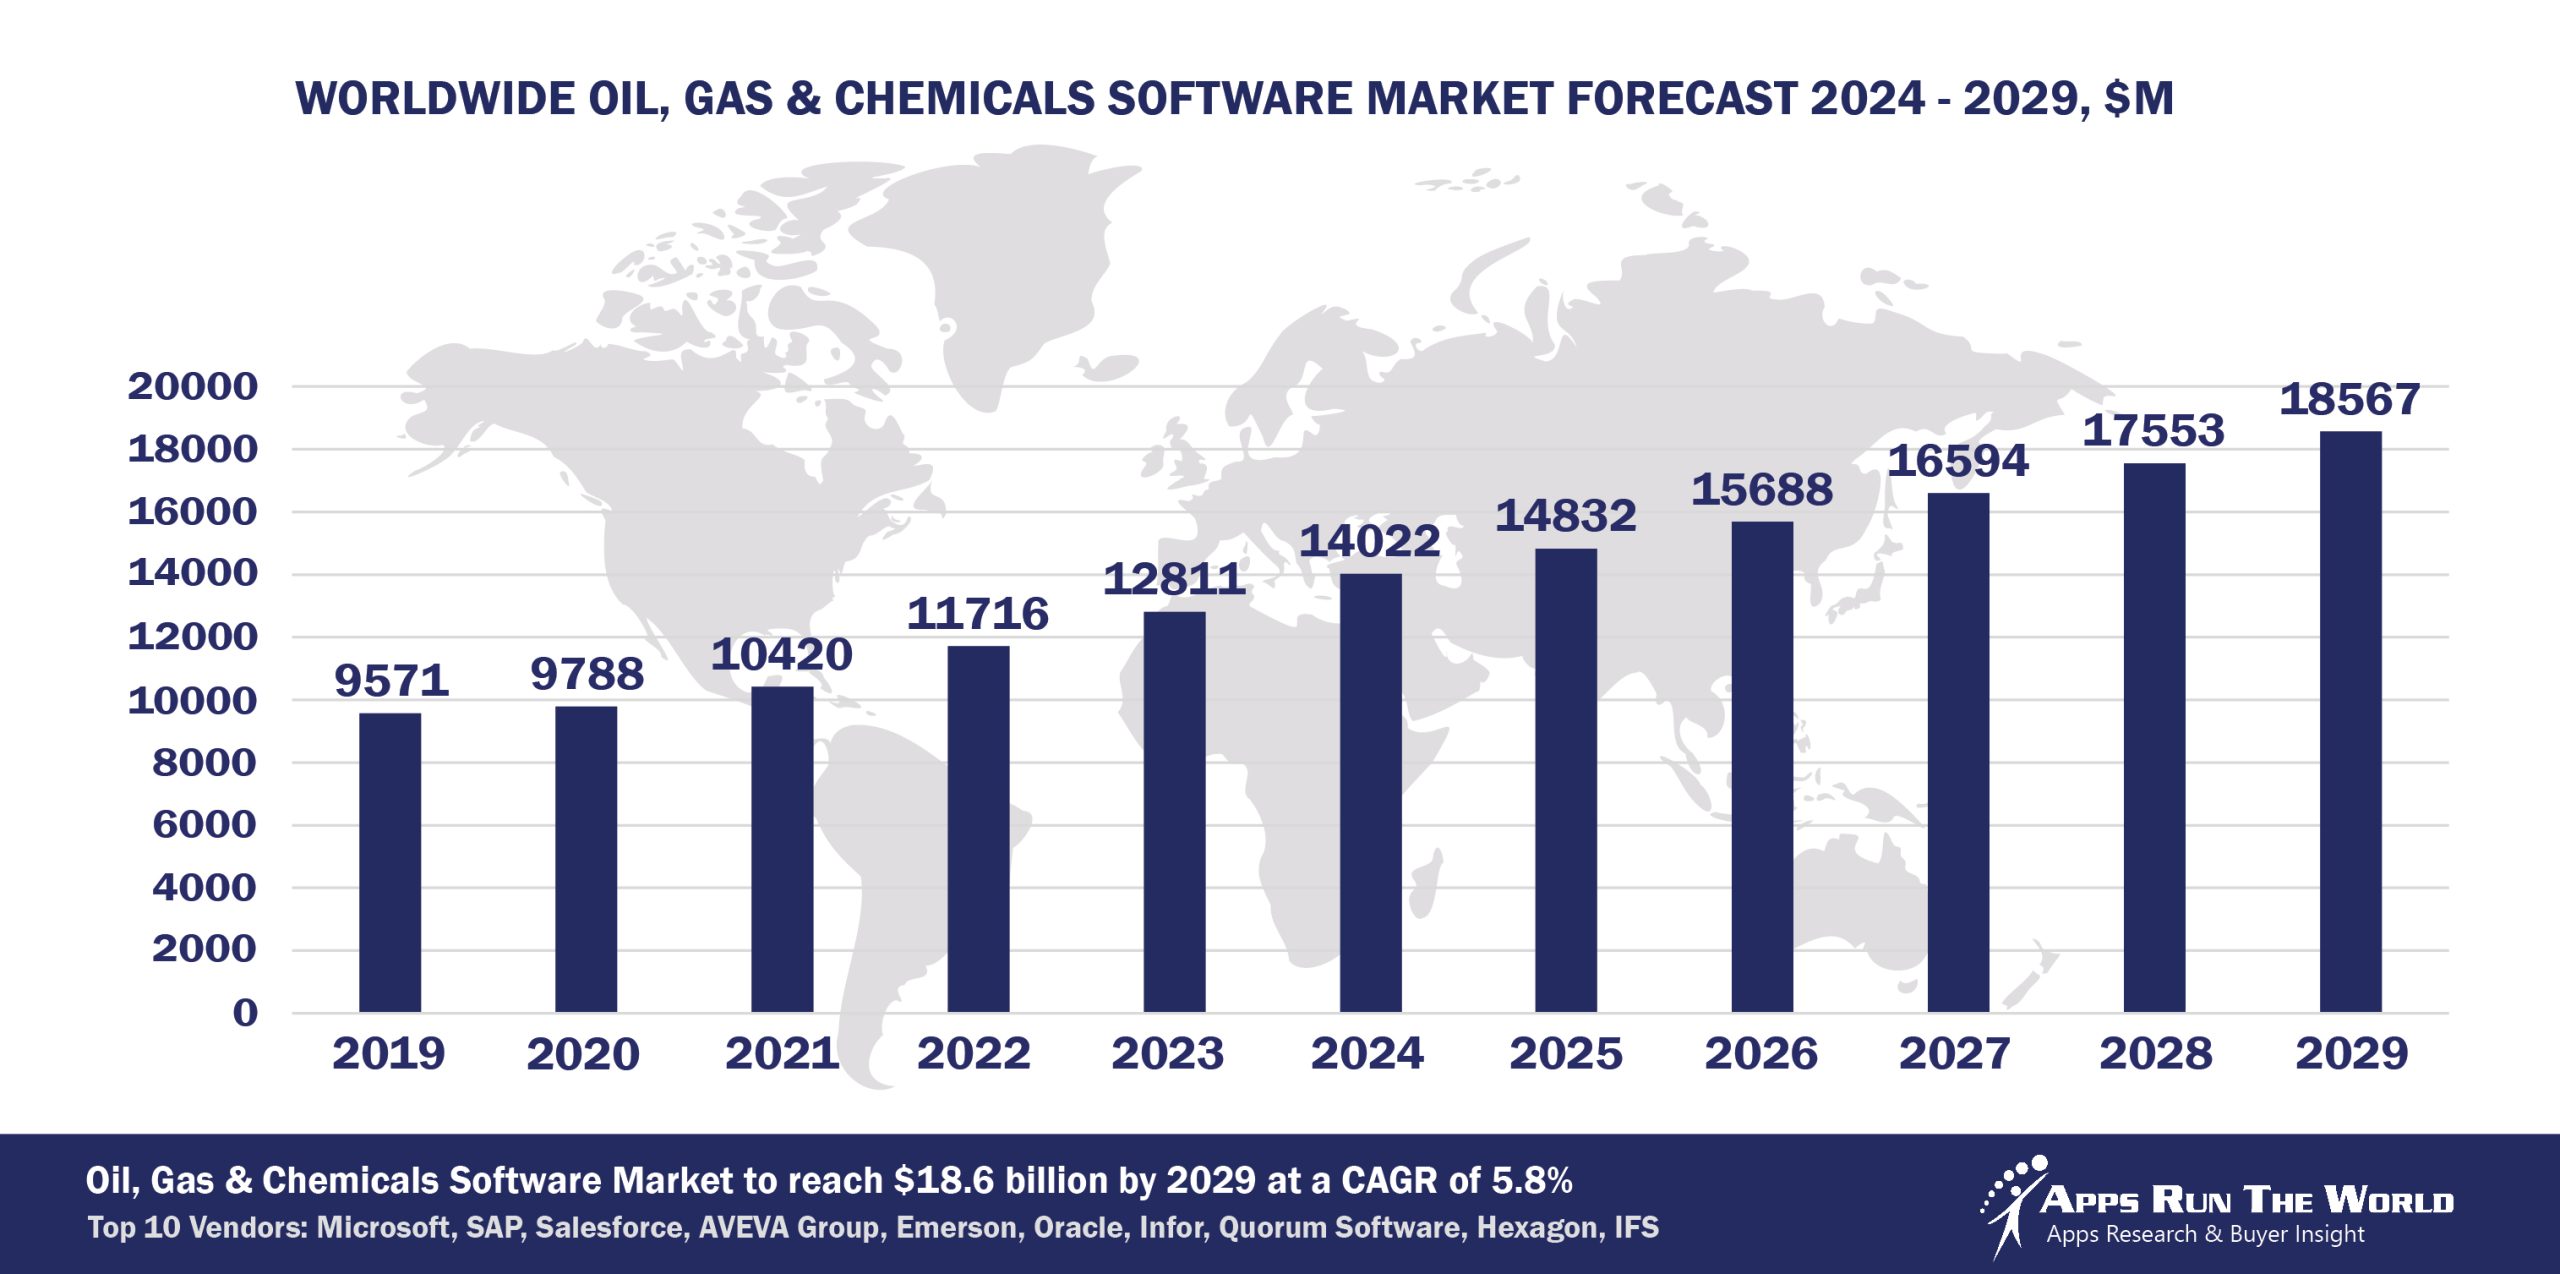
In 2024, the global Oil, Gas, and Chemicals software market grew to $14 billion, marking a 9.5% year-over-year increase. The top 10 vendors accounted for 49.5% of the total market. Microsoft led the pack with a 13.1% market share, followed by SAP, Salesforce, and AVEVA Group.
Through our forecast period, the Oil and Gas applications market size is expected to reach $18.6 billion by 2029, compared with $14 billion in 2024 at a CAGR of 5.8%, as shown in the Apps Top 500 Report – Excel Edition [Preview] .
Oil and Gas, Chemicals (Fuel extraction, petroleum refining, primary derivatives from oil, chemicals, and allied products) – Oil and Gas Operations Management, Reserves Management, Capital Planning, and Budgeting, Well Production Software, Financials, HR, Procurement
Despite slumping oil prices, the long-term outlook is promising as the industry shakeout will increase pressures to contain costs through automation, while advanced project management apps could become more important than ever. Buoyed by low oil prices, chemical makers and downstream distributors will boost IT spend. Cloud migration for some may be slow in areas with bandwidth limitations.
Top 10 Oil, Gas, and Chemicals Software Vendors in 2024 and their Market Shares
Source: Apps Run The World, July 2025
Other Oil, Gas and Chemicals software providers included in the report are: ABB’s Enterprise Software Group, Aclara Software, Adobe, ADP, Altair Engineering, Ansys Inc., Atlassian, Aurea, Autodesk, Axway, Bentley Systems Inc., BlackLine, Circadian, Cisco Systems, Citrix, Computer Methods International Corp., Computer Modeling Group, Constellation Software Inc., Content Guru, Cadence Design Systems, CoreLogic, DocuSign, Dassault Systemes, Dropbox, E2open, Wolters Kluwer, Fischer Solutions Inc., Fiserv, Fluentgrid, GE Digital, Genesys, GEP Procurement, Global Shop Solutions, Google, GPS Insight, Honeywell International, IBS Software Services, IDBS, IFS, IBM, Infor, Intuit Inc., Itron Inc., LeaseCalcs, Locus Technologies, Nakisa, Nice Systems, Objective Corporation, OmniSci, Open Text Corporation, Optalert Limited, ORTEC, OverIT, Pegasystems, ProAlpha, PSI AG, PTC, Qlik, Quantrix, Quorum Business Solutions, River Logic, Rockwell Automation, Schlumberger Software, ServiceNow, Shell Global Solutions International BV, Siemens Digital Industries Software, Teradata Corporation, Trayport, Trimble, TietoEVRY, UKG, Verint Systems Inc., Visma, Vroozi, Workday, Workiva, Zoom Video Communications, and many others.
Vendor Snapshot: Oil and Gas Market Leaders
 Microsoft
Microsoft has advanced its Dynamics 365 Field Service, Finance & Operations, and Business Central for oil & gas by introducing AI-powered predictive maintenance, connected field service management, and low-code Power Platform applications that streamline workflows. Several oil & gas operators now use Microsoft Power Apps to build custom field tools, reducing maintenance costs substantially and optimizing remote operations. The company also integrates Copilot and Azure AI to enhance asset performance, regulatory compliance, and energy transition efforts in industry-specific contexts.
SAP
SAP continues to modernize the oil & gas digital core through S/4HANA, IS-OIL, and industry solution enhancements that emphasize real-time production optimization, sustainability reporting, and integration of digital twins for upstream/midstream/downstream workflows. Recent roadmap updates and industry-focused content highlight investments in AI-enabled forecasting, emissions monitoring, regulatory compliance automation, and embedding sustainability metrics into core ERP processes to support energy transition strategies. SAP’s ongoing co-development with large energy players and its focused solution roadmap reinforce its push to deliver intelligent, cloud-native operations with measurable environmental and operational improvements.
Salesforce
Salesforce has substantially enhanced Field Service for energy and oil & gas through the introduction of Agentforce for Field Service, which brings agentic and generative AI to automate scheduling, troubleshooting, and reporting, reducing friction for frontline technicians. Coupled with predictive work-order routing and real-time service analytics in Sales and Service Cloud, these updates unify field, customer, and asset data to drive faster issue resolution and improve uptime. The company continues to articulate a future shaped by AI agents and data platform integration, positioning its field service capabilities as a productivity multiplier in complex, distributed oilfield environments.
AVEVA Group
AVEVA’s suite—including PI System, Unified Engineering, and Process Simulation—recently introduced integrated industrial analytics, edge-enabled data historian capabilities, and digital twin engineering workflows that support live operational decision-making in oil & gas environments. Investments in unified supply chain and asset information management now support seamless process optimization across plant design, operations, and maintenance. AVEVA continues to refine its supply-chain and engineering platforms with enhanced simulation and AI-powered anomaly detection tools.
Emerson (inc. Aspen)
Emerson’s strategic evolution—accelerated by its 2025 consolidation with AspenTech—has strengthened its footprint in oil & gas through an integrated automation and data fabric approach, combining DeltaV, Aspen HYSYS, DMC3, and Mtell for real-time process control, predictive maintenance, and AI-driven anomaly detection. The collaboration on industrial data initiatives (e.g., with TotalEnergies) and the broader “Project Beyond” effort reflects an investment in open, software-defined infrastructure to support energy transition use cases and operational resilience. These developments aim to unify OT/IT data, boost uptime, and provide smarter, AI-enhanced optimization at scale.
Oracle
Oracle has enhanced its Cloud ERP, EPM, SCM, and maintenance capabilities for oil & gas clients by embedding AI agents to automate financial forecasting, anomaly detection, and supply chain decision-making, and by extending predictive maintenance and connected planning across complex global operations. Its recent announcements emphasize AI-powered supply chain visibility, carbon accounting support, and integrated digital transformation for energy sector CFOs aiming to balance cost, risk, and sustainability. Oracle’s cloud-based modernization initiatives (including success stories like Williams Companies) underscore its push to replace legacy systems with scalable, data-driven operational platforms.
Infor
Infor has advanced its CloudSuite Chemical and Industrial offerings with industry-specific AI enhancements that turn operational data into actionable insights for predictive maintenance, compliance, and agile decision-making in oil & gas environments. The platform’s cloud-native architecture, low-code extensibility, and integrated ESG and quality controls cater to upstream and downstream efficiency pressures, while continuous investment in the Infor OS ecosystem reinforces real-time visibility and automation. These updates aim to reduce downtime, accelerate innovation, and help operators manage complexity amid volatile market conditions.
Quorum Software
Quorum Software has enriched its OGsys On Demand, myQuorum Accounting, and Aucerna PetroVR portfolio with enhanced development simulation, capital planning accuracy, and integrated business planning tools tailored for upstream and midstream oil & gas economics. Recent advancements emphasize risk-weighted asset development modeling, streamlined accounting workflows, and cloud-based financial visibility that support tighter cost control and scenario-driven investment decisions. Quorum’s continued focus on cross-platform integration and digital project modeling helps operators align technical, financial, and strategic planning.
Hexagon
Hexagon is reinforcing oil & gas capital and asset lifecycle management through innovations in HxGN EAM, EcoSys, and CADWorx, integrating machine learning for cost forecasting, risk simulation, and design automation within digital twin frameworks. Its award-winning HxGN Alix solution highlights industry recognition for AI and twin-enabled capabilities that drive reliability and operational insights, while EcoSys delivers enhanced program controls and benchmarking for large-scale investments. Hexagon continues expanding its strategic customer engagement via elite awards and success stories to validate its approach to intelligent, connected project execution.
IFS
IFS, through its Energy & Resources unit (formerly P2 Energy Solutions), released IFS BOLO 15 and adjacent product enhancements that embed IFS.ai to deliver significant back-office efficiency, predictive automation, and streamlined accounting for oil & gas operators pursuing both reliability and sustainability. The vendor’s broader cloud-native digital transformation narrative emphasizes asset optimization, scenario modeling, and ESG readiness, positioning its integrated suite (including Excalibur and Merrick) as a platform for operational agility in a changing energy landscape. IFS’s publicized thought leadership on energy trends and continued consolidation of its upstream-focused solutions reinforce its commitment to AI-driven efficiency and strategic modernization.
ARTW Technographics Platform: Oil and Gas customer wins
Since 2010, our research team has been studying the patterns of Oil and Gas software purchases, analyzing customer behavior and vendor performance through continuous win/loss analysis. Updated quarterly, the ARTW Technographics Platform provides deep insights into thousands of Oil and Gas customer wins and losses, helping users monitor competitive shifts, evaluate vendor momentum, and make informed go-to-market decisions.
List of Oil and Gas customers
Source: ARTW Buyer Insights Technographic Database
Custom data cuts related to the Oil, Gas and Chemicals Applications market are available:
- Top 850+ Oil, Gas and Chemicals Applications Vendors and Market Forecast 2024-2029
- 2024 Oil, Gas and Chemicals Applications Market By Functional Market (16 Markets)
- 2024 Oil, Gas and Chemicals Applications Market By Country (USA + 45 countries)
- 2024 Oil, Gas and Chemicals Applications Market By Region (Americas, EMEA, APAC)
- 2024 Oil, Gas and Chemicals Applications Market By Revenue Type (License, Services, Hardware, Support and Maintenance, Cloud)
- 2024 Oil, Gas and Chemicals Applications Market By Customer Size (revenue, employee count, asset)
- 2024 Oil, Gas and Chemicals Applications Market By Channel (Direct vs Indirect)
- 2024 Oil, Gas and Chemicals Applications Market By Product
Worldwide Enterprise Applications by Vertical Market
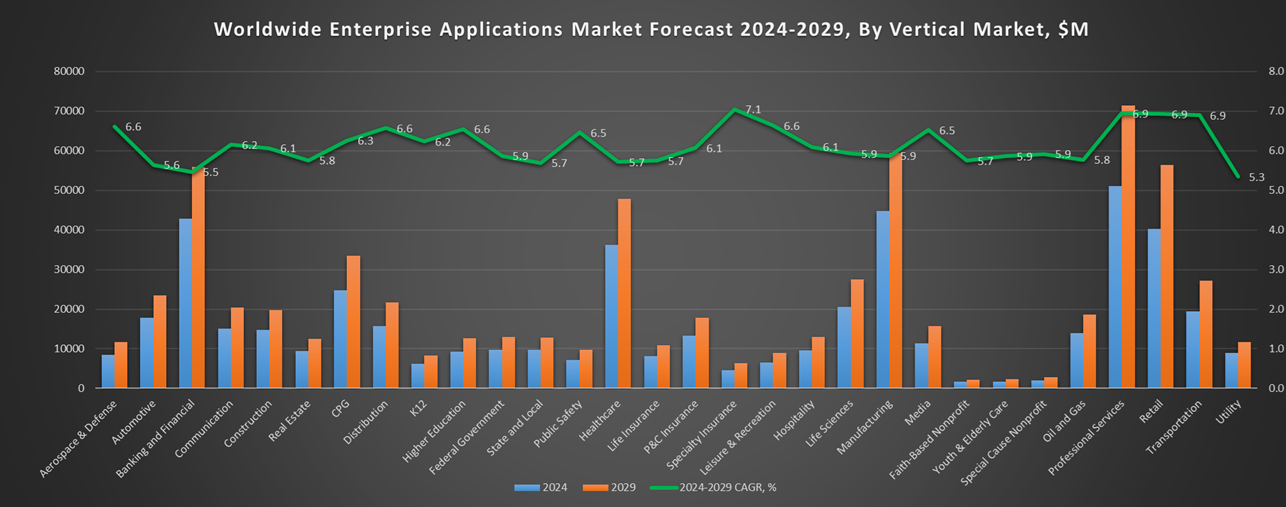
Exhibit 3 provides a forecast of the worldwide enterprise applications by vertical market from 2024 to 2029, highlighting market sizes, year-over-year growth, and compound annual growth rates across different industry sectors from Aerospace and Defense to Utilities.
Exhibit 3: Worldwide Enterprise Applications by Vertical Market Forecast 2024-2029 by Functional Market ($M)
Source: Apps Run The World, July 2025
Exhibit 4 shows our projections for the enterprise applications market by vertical segment, based on the buying preferences and the customer propensity to invest in new software within those industries as they continue to upgrade and replace many legacy industry-specific applications that have been identified and tracked in our Buyer Insight Database.
FAQ – APPS RUN THE WORLD Top 10 Oil & Gas Software Vendors, Market Size & Forecast
Q1. What is the global Oil & Gas software market size in 2024?
A: The global Oil, Gas & Chemicals software market reached $14 billion in 2024, growing 9.5% year-over-year as companies ramped up digital transformation and automation initiatives.
Q2. Who are the top 10 Oil & Gas software vendors in 2024 and their combined share?
A: The top 10 vendors are Microsoft, SAP, Salesforce, AVEVA Group, Emerson (including AspenTech), Oracle, Infor, Quorum Software, Hexagon, and IFS, collectively capturing 49.5% of the market.
Q3. Which vendor leads the Oil & Gas software market in 2024?
A: Microsoft leads the Oil & Gas software market in 2024 with a 13.1% market share, driven by its cloud platform, data services, and integration across upstream and downstream operations.
Q4. What is the forecast for the Oil & Gas software market through 2029?
A: The market is projected to reach $18.6 billion by 2029, expanding at a 5.8% compound annual growth rate fueled by energy transition, IoT, and intelligent asset management.
Q5. What applications are included in the scope of the Oil & Gas software market?
A: The market includes software for Oil & Gas operations, capital planning, well production, financials, HCM, supply chain, and compliance across upstream, midstream, and downstream.
Q6. Which other Oil & Gas software vendors are covered beyond the top 10?
A: Other vendors featured in the report include AspenTech, P2 Energy Solutions, MerckWorks, CGI, and Aucerna, offering specialized solutions for production optimization and asset lifecycle management.
Q7. When was this Oil & Gas software report published, and by whom?
A: The report was published in July 2025 by APPS RUN THE WORLD analysts as part of the APPS TOP 500 research program, which benchmarks the revenues and market share of the world’s 1,500+ largest enterprise application vendors.
More Enterprise Applications Research Findings
Based on the latest annual survey of 10,000+ enterprise software vendors, Apps Run The World is releasing a number of dedicated reports, which profile the world’s 1,500 largest Enterprise Applications Vendors ranked by their 2024 product revenues. Their 2024 results are being broken down, sorted and ranked across 16 functional areas (from Analytics and BI to Treasury and Risk Management) and by 21 vertical industries (from Aerospace to Utility), as shown in our Taxonomy. Further breakdowns by subvertical, country, company size, etc. are available as custom data cuts per special request.
Research Methodology
Each year our global team of researchers conduct an annual survey of thousands of enterprise software vendors by contacting them directly on their latest quarterly and annual revenues by country, functional area, and vertical market.
We supplement their written responses with our own primary research to determine quarterly and yearly growth rates, In addition to customer wins to ascertain whether these are net new purchases or expansions of existing implementations.
Another dimension of our proactive research process is through continuous improvement of our customer database, which stores more than one million records on the enterprise software landscape of over 2 million organizations around the world.
The database provides customer insight and contextual information on what types of enterprise software systems and other relevant technologies are they running and their propensity to invest further with their current or new suppliers as part of their overall IT transformation projects to stay competitive, fend off threats from disruptive forces, or comply with internal mandates to improve overall enterprise efficiency.
The result is a combination of supply-side data and demand-generation customer insight that allows our clients to better position themselves in anticipation of the next wave that will reshape the enterprise software marketplace for years to come.
- Its Communications, a Japan based Communications organization with 692 Employees
- Plural Strategy, a United Kingdom based Professional Services company with 60 Employees
- Pneumatech, a Belgium based Manufacturing organization with 140 Employees
| Logo | Company | Industry | Employees | Revenue | Country | Evaluated |
|---|
