
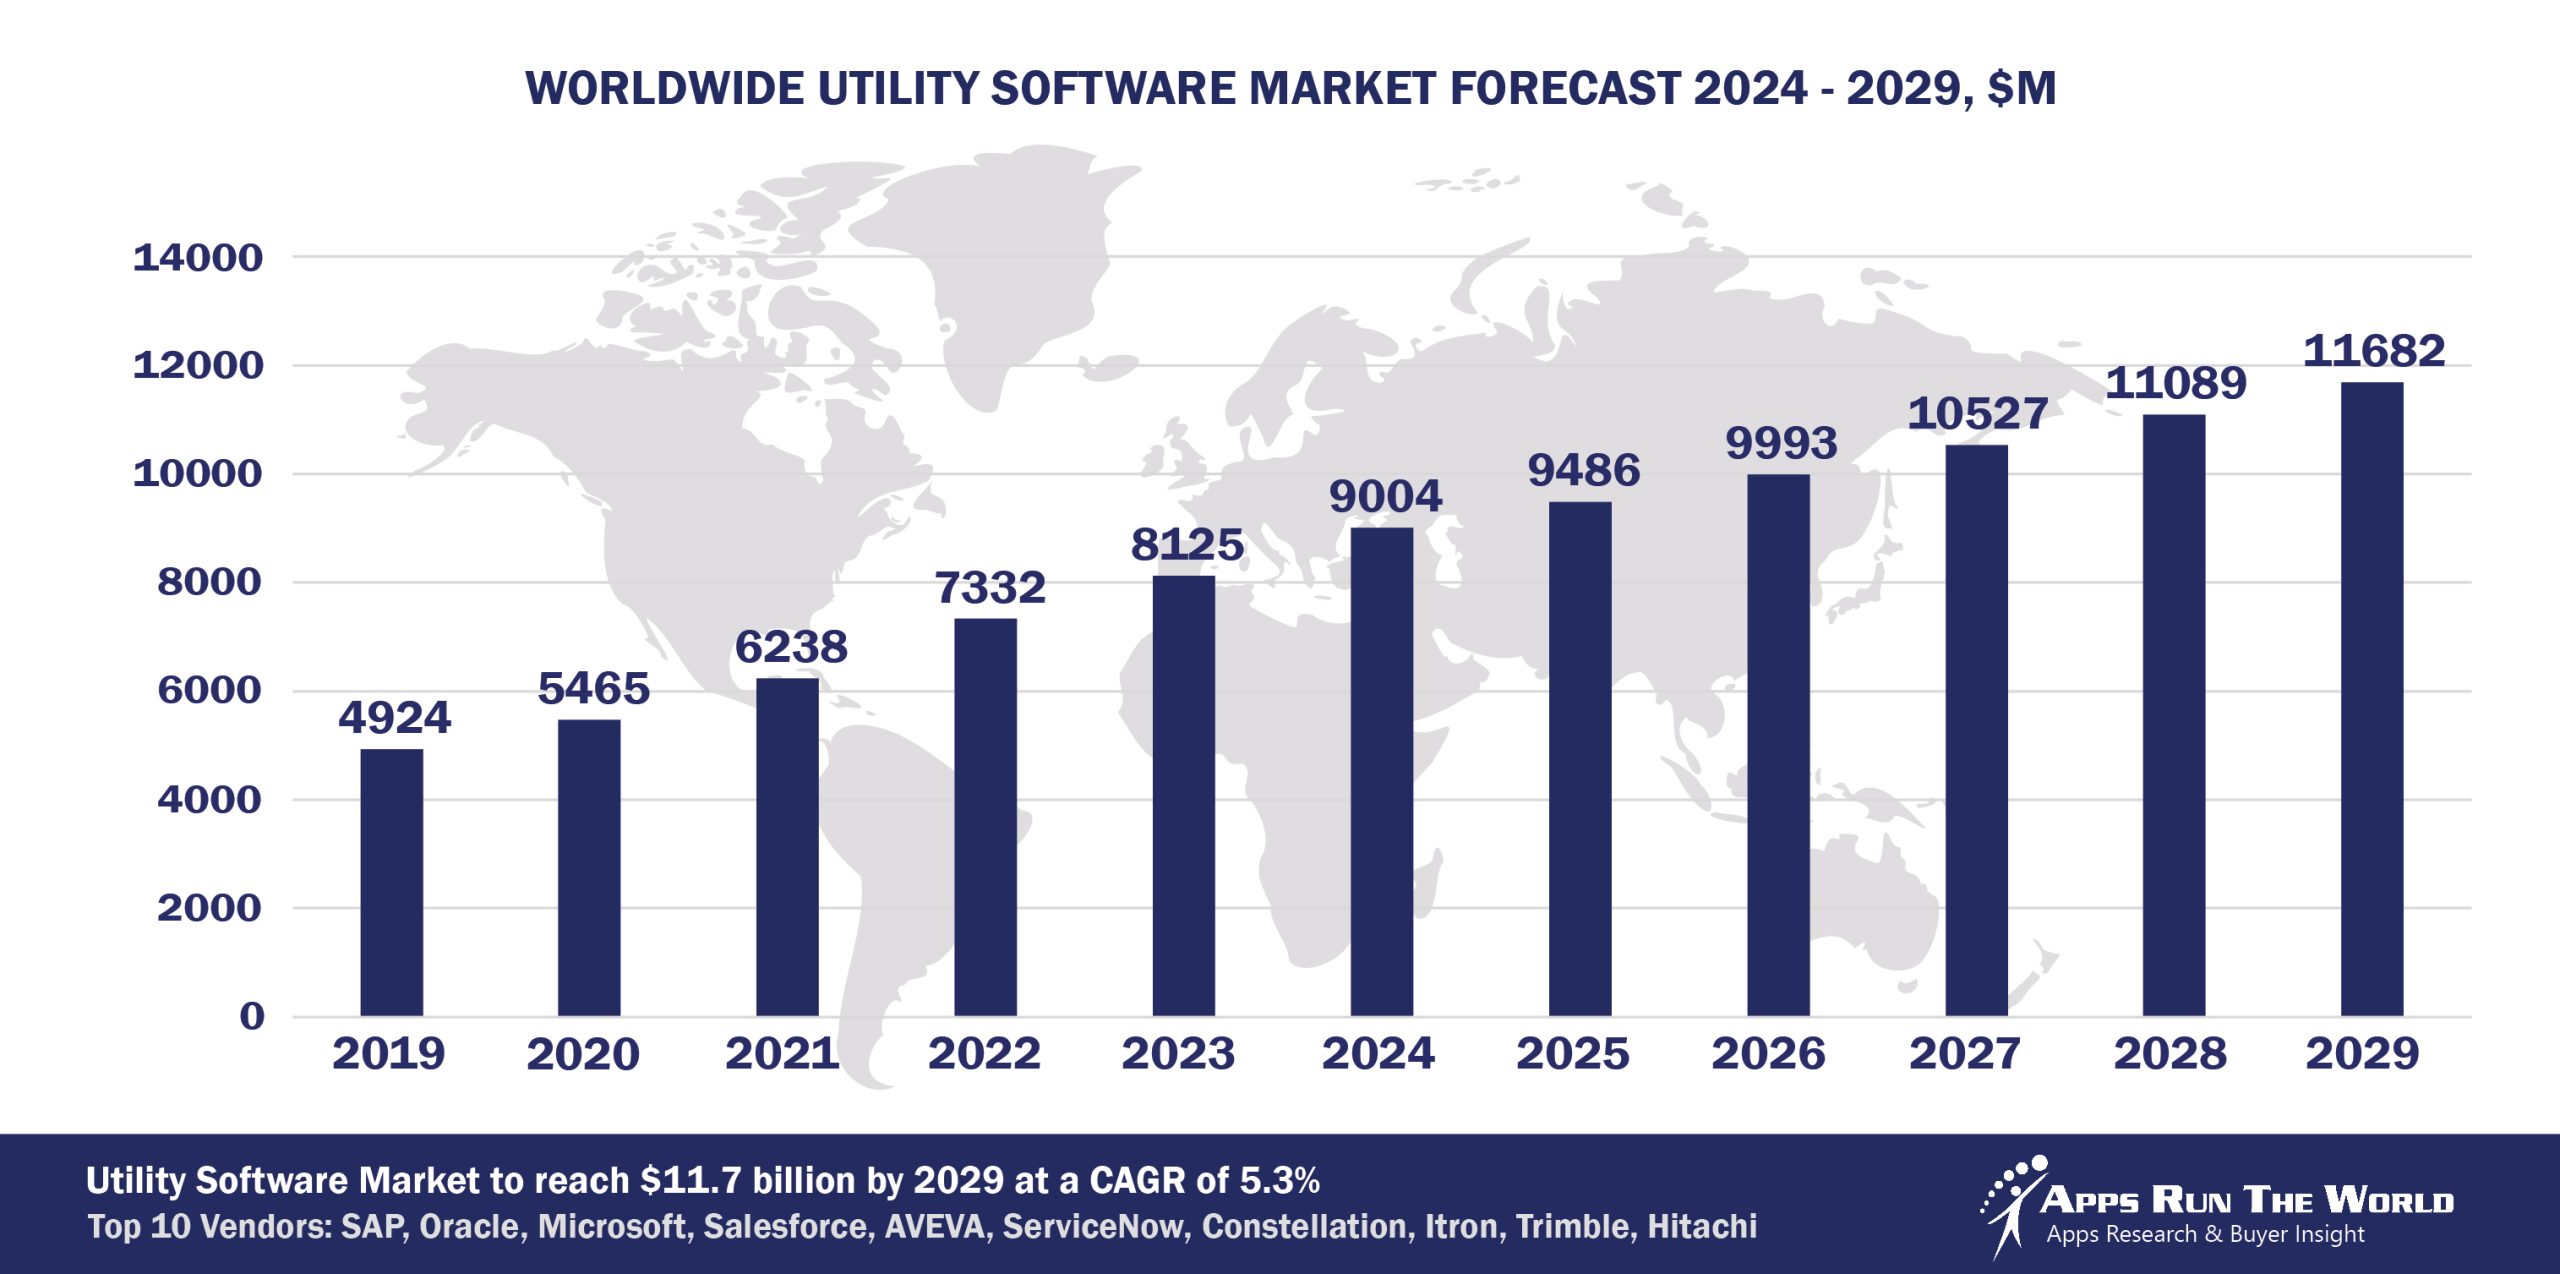
In 2024, the global Utility software market grew to $9 billion, marking a 10.8% year-over-year increase. The top 10 vendors accounted for 33.9% of the total market. SAP led the pack with a 6.2% market share, followed by Oracle, Microsoft, and Salesforce.
Through our forecast period, the Transportation applications market size is expected to reach $11.7 billion by 2029, compared with $9 billion in 2024 at a CAGR of 5.3%, as shown in the Apps Top 500 Report – Excel Edition [Preview] .
Utilities (Electricity, water and gas utilities) – Customer care, billing, Smart meter infrastructure, Energy Trading Risk Management, SCADA, Financials, HR, Procurement
Smart grid investment will begin to taper off and the vertical could see more upheavals as utilities anticipate the fallout from the decision of some of their largest customers to replace conventional electricity with alternative energy sources. Internet of Things could usher in a new set of maintenance management apps.
Top 10 Utility Software Vendors in 2024 and their Market Shares
Source: Apps Run The World, July 2025
Other Utility software providers included in the report are: ACI Worldwide, Inc., Amdocs, Asseco Group, Aurea, Adobe, Autodesk, AVEVA Group, Bentley Systems Inc., Capita Software, CGI Group Inc., Circadian, Cisco Systems, Computer Modeling Group, Constellation Software Inc., CoreLogic, Inc., CSG Systems International, Dassault Systemes, Doxee, Dropbox, Edgeverve, an Infosys company, ENGIE Impact, Field Nation, Fiserv, Fluentgrid, GE Digital, Genesys Telecommunications Laboratories, Gtreasury, Hansen Technologies, Hexagon, HRsoft, IDBS, IBM, Infor, Informatica, Intuit Inc., Itineris, Locus Technologies, MYOB, Motorola Solutions, Open Text Corporation, OATI, OverIT, PSI AG, PTC, Qlik, River Logic, Inc., Roper Technologies, Inc., Sage, SAS Institute, ServiceNow, Siemens Digital Industries Software, SplashBI, Squiz, Pegasystems, Times Software Pte Ltd, Tyler Technologies, Trayport, a TMX Group Company, UNIT4, Workday, ZaiLab, Zellis (ex NGA Human Resources UK & Ireland), Zendesk, Zoho Corp., Zoom Video Communications and others.
Vendor Snapshot: Utility Market Leaders
 SAP
SAP
SAP is pivoting its Utilities portfolio toward an agent-native operating model, anchored around its Joule AI and autonomous agent network. At Sapphire 2025, SAP unveiled a production-grade network of cross-functional agents that orchestrate utilities‑specific workflows like billing reconciliation, demand‑supply coordination, and uptime optimization, all via low-code orchestration embedded into its business suite. CEO Christian Klein underscored the deployment of sales and supply‑chain agents that collaborate to align pricing, resource availability, and grid reliability in real time—emphasizing contextual data coherence and compliance governance as core to the agentic rollout.
Oracle
Oracle is embedding agentic and autonomous capabilities directly into its Utilities business suite through both platform upgrades and tools like AI Agent Studio. The company launched Oracle Energy and Water Data Intelligence, designed specifically for utilities, to unify operations data and enable vertically tuned AI‑powered analytics that feed self‑acting agents managing grid load, anomaly detection, billing insights, and customer engagement workflows. Complementing this, Oracle AI Agent Studio empowers customers and partners in utilities to craft, deploy, and govern custom or pre‑packaged agents that integrate into smart meter services, outage management, and service dispatch workflows—all without code. The agency of these agents is woven into Oracle’s go‑to‑market as a unified AI layer over legacy utility applications.
Microsoft
Microsoft is accelerating its utilities innovation via agentic Field Assist and Copilot initiatives built on Azure OpenAI. Its Field Service solution for utilities uses Retrieval‑Augmented Generation and autonomous task agents to ingest sensor or customer data, draft work orders, guide field technicians via voice or chat, and trigger dispatch workflows automatically, blending safety, compliance, and efficiency on-site. Meanwhile, the launch of Azure AI Agent Service and Copilot Studio enables utilities teams to build domain-specific AI agents, using no‑/low‑code natural‑language interfaces or via developer SDKs, to automate demand forecasting, outage response, and customer service tasks.
Salesforce
Salesforce has introduced its AgentExchange, a marketplace and low‑code framework for AI agents that automate administrative and customer‑service tasks. Though many cases cited are healthcare or enterprise-wide, the same architecture is deployed into utility CRM and field scenarios: conversational agents that summarize service calls, manage proactive outreach, and coordinate multi-step assistance flows.
AVEVA Group
AVEVA is advancing agentic utilities operations through predictive and autonomous analytics layers integrated into its monitoring and asset management platform. Agents monitor grid and plant telemetry via its PI System, autonomously detect anomalies, generate corrective work orders, and trigger workflows in maintenance systems. AVEVA’s predictive analytics and real‑time insights capabilities are increasingly packaged as intelligent operations bots that orchestrate downstream systems.
ServiceNow
ServiceNow is positioning itself as an agent‑centric orchestration layer for utility operations, extending beyond ITSM into field service and asset management. Its Now Platform now includes AI Agents, built natively with Now Assist, that autonomously execute workflow logic and govern autonomy across entire operations, supporting utilities in dispatch, outage resolution, and asset insights. Recent partnerships with TechSee enable agentic visual AI diagnostics embedded into service workflows, guiding technicians live using visual cues and remote assistance, reducing mean time to resolution.
Constellation Software
Constellation is embedding automated diagnostics and decision‑guidance agents into its customer information and ERP systems tailored for energy and water utilities. These agents autonomously flag billing anomalies, suggest rate plan optimizations, or automate meter‑based dispatch alerts, all surfaced in agent‑guided dashboards. Constellation’s strategic investment in vertical-focused CIS/ERP systems and recent acquisitions suggest increasing movement toward low‑code configurability and embedded AI assistance for billing, CRM, and field workload automation, helping utilities shift toward more autonomous operations.
Itron Inc.
Itron is evolving its meter data and DER (distributed energy resource) platform toward agentic automation by layering AI agents on top of IntelliFLEX and MDM systems. These agents autonomously detect meter anomalies, forecast DER behavior, manage load balancing actions, and integrate with grid operation workflows, all without manual intervention. The agentic layer improves anomaly detection latency and automates reporting/alert issuance to utilities or grid operators.
Trimble
Trimble is infusing its utility field mobility and network management platforms (NIS, AMS) with intelligent agents that autonomously coordinate crew scheduling, outage detection, and asset inspection workflows. Its mobile apps are gaining voice‑enabled assistants that guide field crews through complex inspection protocols, flag hazards, and suggest corrective tasks in real‑time. Trimble is gradually adding low‑code agent templates within its Unity AMS portfolio to automate scheduling, asset alerts, and compliance checks.
Hitachi
Hitachi is embedding agentic AI across its operational platforms (Lumada APM, Velocity Suite, Ellipse) to enable autonomous asset monitoring, risk prediction, and self‑acting maintenance workflows in utilities. Agents within Lumada can detect performance degradation, simulate repair impact, and proactively schedule work using autonomous orchestration. In Velocity Suite and Ellipse, these agents generate procurement requests, workforce dispatches, and service coordination without human input.
ARTW Technographics Platform: Utility customer wins
Since 2010, our research team has been studying the patterns of Utility software purchases, analyzing customer behavior and vendor performance through continuous win/loss analysis. Updated quarterly, the ARTW Technographics Platform provides deep insights into thousands of Utility customer wins and losses, helping users monitor competitive shifts, evaluate vendor momentum, and make informed go-to-market decisions.
List of Utility customers
Source: ARTW Buyer Insights Technographic Database
Custom data cuts related to the Utility Applications market are available:
- Top 850+ Utility Applications Vendors and Market Forecast 2024-2029
- 2024 Utility Applications Market By Functional Market (16 Markets)
- 2024 Utility Applications Market By Country (USA + 45 countries)
- 2024 Utility Applications Market By Region (Americas, EMEA, APAC)
- 2024 Utility Applications Market By Revenue Type (License, Services, Hardware, Support and Maintenance, Cloud)
- 2024 Utility Applications Market By Customer Size (revenue, employee count, asset)
- 2024 Utility Applications Market By Channel (Direct vs Indirect)
- 2024 Utility Applications Market By Product
Worldwide Enterprise Applications by Vertical Market
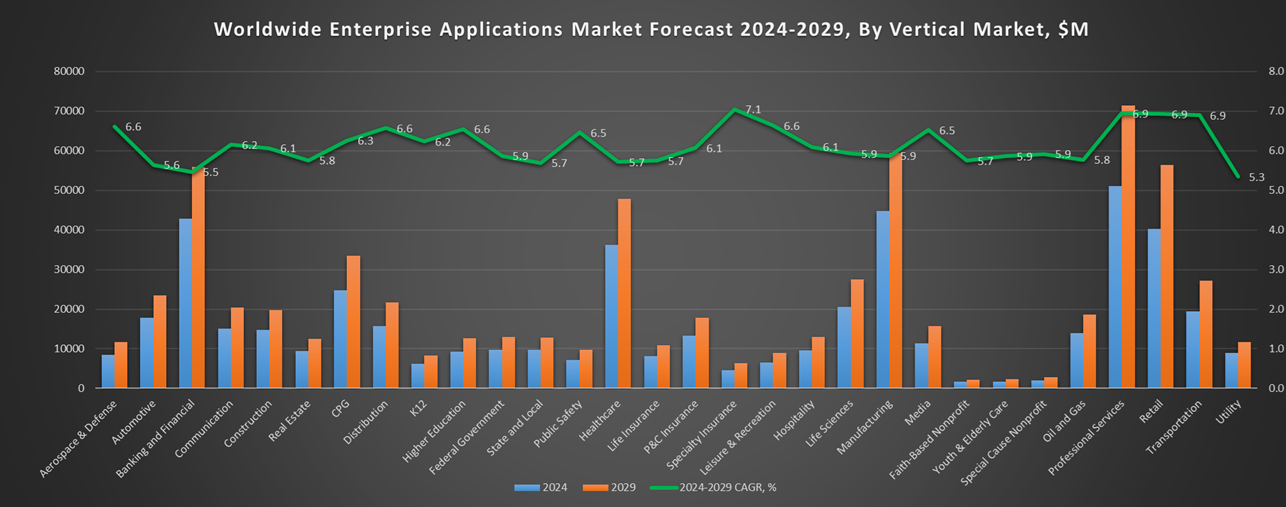
Exhibit 3 provides a forecast of the worldwide enterprise applications by vertical market from 2024 to 2029, highlighting market sizes, year-over-year growth, and compound annual growth rates across different industry sectors from Aerospace and Defense to Utilities.
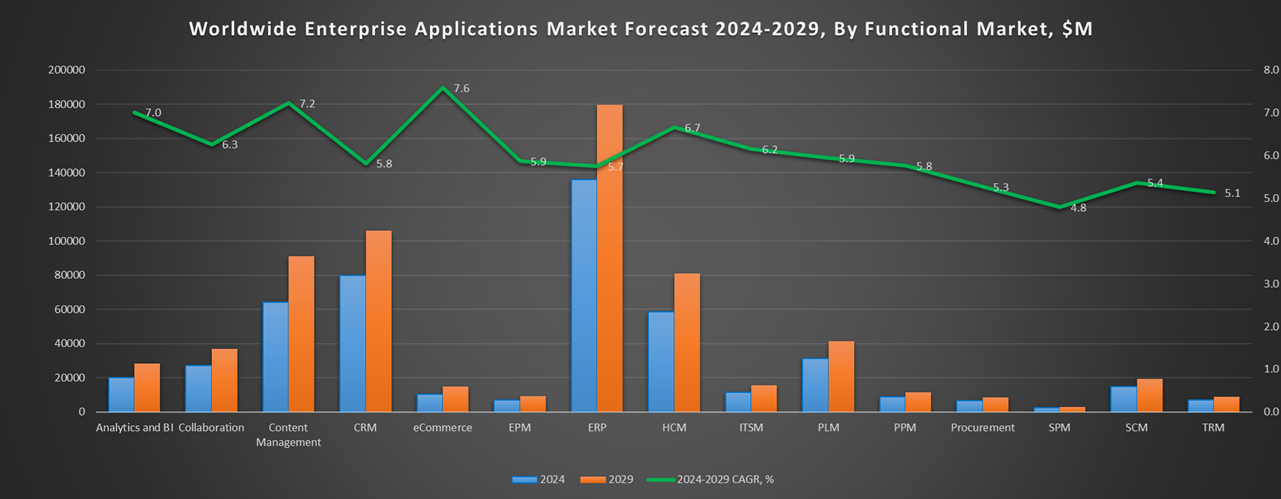
Exhibit 3: Worldwide Enterprise Applications by Vertical Market Forecast 2024-2029 by Functional Market ($M)
Source: Apps Run The World, July 2025
Exhibit 4 shows our projections for the enterprise applications market by vertical segment, based on the buying preferences and the customer propensity to invest in new software within those industries as they continue to upgrade and replace many legacy industry-specific applications that have been identified and tracked in our Buyer Insight Database.
FAQ – APPS RUN THE WORLD Top 10 Utilities Software Vendors, Market Size & Forecast
Q1. What is the global Utilities software market size in 2024?
The global Utilities software market reached $9 billion in 2024, growing 10.8% year-over-year.
Q2. Who are the top 10 Utilities software vendors in 2024 and their combined share?
The top 10 vendors are SAP, Oracle, Microsoft, Salesforce, AVEVA Group, ServiceNow, Constellation Software, Itron Inc., Trimble, and Hitachi, together accounting for 33.9% of the market.
Q3. Which vendor leads the Utilities software market in 2024?
SAP leads with a 6.2% market share, driven by its Joule AI and autonomous agent network.
Q4. What is the forecast for the Utilities software market through 2029?
The market is projected to reach $11.7 billion by 2029, growing at a compound annual growth rate (CAGR) of 5.3%.
Q5. What applications are included in the scope of the Utilities software market?
The market encompasses customer care, billing, smart meter infrastructure, energy trading risk management, SCADA, financials, HR, and procurement.
Q6. Which other Utilities software vendors are covered beyond the top 10?
Additional vendors profiled include AspenTech, P2 Energy Solutions, MerckWorks, CGI, and Aucerna, offering specialized solutions for simulation, asset lifecycle, and regulatory compliance.
Q7. When was this Utilities software report published, and by whom?
The report was published in July 2025 by APPS RUN THE WORLD analysts, as part of the APPS TOP 500 research program, which benchmarks the revenues and market share of the world’s 1,500+ largest enterprise application vendors.
More Enterprise Applications Research Findings
Based on the latest annual survey of 10,000+ enterprise software vendors, Apps Run The World is releasing a number of dedicated reports, which profile the world’s 1,500 largest Enterprise Applications Vendors ranked by their 2024 product revenues. Their 2024 results are being broken down, sorted and ranked across 16 functional areas (from Analytics and BI to Treasury and Risk Management) and by 21 vertical industries (from Aerospace to Utility), as shown in our Taxonomy. Further breakdowns by subvertical, country, company size, etc. are available as custom data cuts per special request.
Research Methodology
Each year our global team of researchers conduct an annual survey of thousands of enterprise software vendors by contacting them directly on their latest quarterly and annual revenues by country, functional area, and vertical market.
We supplement their written responses with our own primary research to determine quarterly and yearly growth rates, In addition to customer wins to ascertain whether these are net new purchases or expansions of existing implementations.
Another dimension of our proactive research process is through continuous improvement of our customer database, which stores more than one million records on the enterprise software landscape of over 2 million organizations around the world.
The database provides customer insight and contextual information on what types of enterprise software systems and other relevant technologies are they running and their propensity to invest further with their current or new suppliers as part of their overall IT transformation projects to stay competitive, fend off threats from disruptive forces, or comply with internal mandates to improve overall enterprise efficiency.
The result is a combination of supply-side data and demand-generation customer insight that allows our clients to better position themselves in anticipation of the next wave that will reshape the enterprise software marketplace for years to come.
- Its Communications, a Japan based Communications organization with 692 Employees
- SAP, a Germany based Professional Services company with 110650 Employees
- L&T Rubber Processing Machinery, a India based Professional Services organization with 1000 Employees
| Logo | Company | Industry | Employees | Revenue | Country | Evaluated |
|---|
