
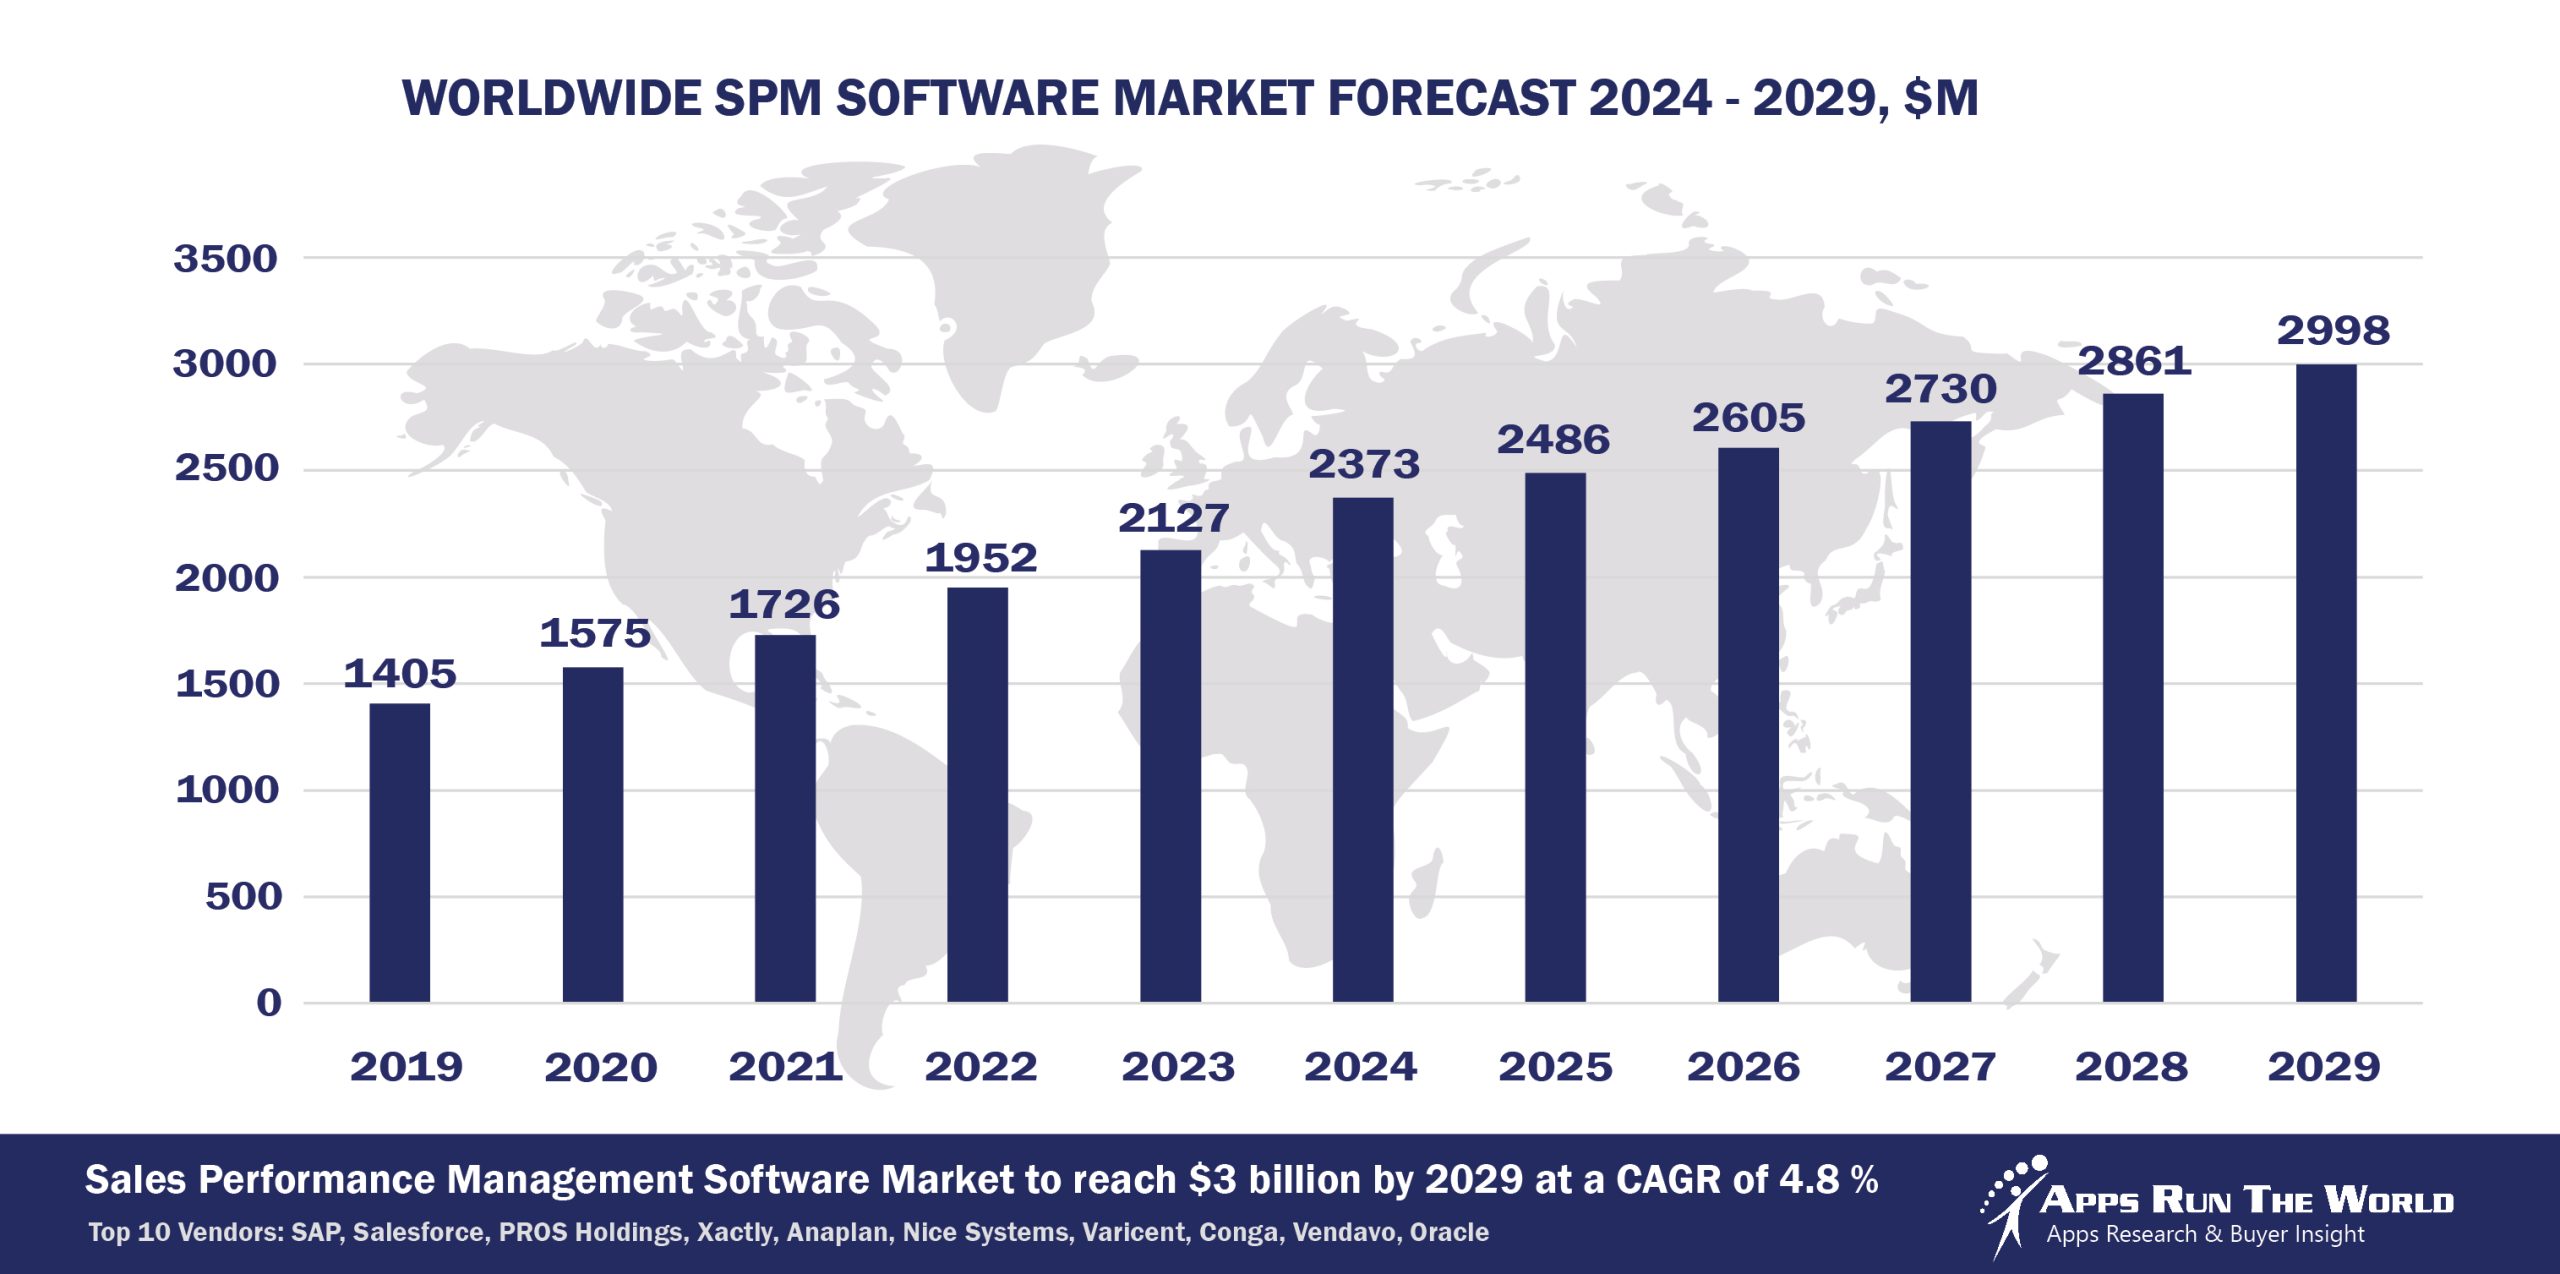
In 2024, the global Sales Performance Management (SPM) software market grew to $2.4 billion, marking an 11.5% year-over-year increase. The top 10 vendors accounted for 57.8% of the total market. SAP led the pack with a 12.5% market share, followed by Salesforce, PROS Holdings, Xactly, and Anaplan.
Through our forecast period, the SPM applications market size is expected to reach $3 billion by 2029, compared with $2.4 billion in 2024 at a CAGR of 4.8%, as shown in the Apps Top 500 Report – Excel Edition [Preview] .
Sales Performance Management tracks and automates different incentive compensation programs for salespeople as well as other functions specific to inside, outbound, and channel sales activities, including territory and quota management, account segmentation and scoring, and deal and quote management. SPM applications revenues represent a major contributor to the Human Capital Management market as part of our market sizing exercise.
Incentive compensation gains traction across service sectors with Cloud startups exploiting flexible pricing to gain an upper hand.
Top 10 Sales Performance Management Vendors in 2024 and their Market Shares
Source: Apps Run The World, July 2025
Other SPM software providers included in the report are: CDK Global, Cox Automotive, CloudSense, Gong, Microsoft, Iconixx, Incentives Solutions, InsightSquared, Nice Systems, Optymyze, Performio, Price f(x) AG, SAS Institute, QuickBase, Veeva Systems, Workday, Xoxoday, Zuora, and others.
Vendor Snapshot: SPM Market Leaders
 SAP
SAP
SAP has expanded its sales performance portfolio by unifying incentive compensation and agent performance management under a common skills and goals framework. By integrating SAP CPQ (formerly CallidusCloud CPQ), SAP ensures a seamless transition from quotes to payments. The company is doubling down on Business AI to automate commission calculations and deliver real-time performance insights to sales leaders. Following its 2025 acquisition of SmartRecruiters, SAP is positioning itself to offer a more complete talent acquisition and compensation suite—solidifying its vision for end-to-end revenue operations.
Salesforce
Salesforce is reshaping its Sales Performance Management strategy following the announced sunsetting of Salesforce CPQ (originally SteelBrick), redirecting focus toward ecosystem partnerships and modular, AI-native tools. The company continues to enhance its SPM suite with Einstein-powered forecasting, quota attainment insights, and anomaly detection, giving sales leaders predictive control over revenue pipelines. Salesforce’s integration with Spiff supports real-time incentive tracking and transparent commission reporting, while recent investments by Salesforce Ventures in conversational AI startups reinforce its pivot toward next-gen, agentic revenue operations. The transition away from legacy CPQ marks a shift toward composable, partner-led quote-to-cash experiences within the broader Salesforce platform.
PROS Holdings
PROS Holdings delivers a high-impact solution for complex B2B sales with PROS Smart CPQ, which uses dynamic pricing algorithms and prescriptive analytics to optimize quote turnaround and deal profitability. The introduction of PROS AI Agents enables real-time guidance—such as adaptive price adjustments and bundling recommendations—embedded directly within quoting workflows. Continued investment in AI-powered elasticity modeling and customer segmentation underscores PROS’ commitment to precision pricing and intelligent incentive design.
Xactly
Xactly’s Incent Enterprise and Design modules harness machine-learning engines to recommend plan adjustments and territory realignments, reducing overpayments and improving ROI. In early 2025, Xactly introduced Xactly Intelligence, layering predictive AI and generative insights across commission forecasting and anomaly detection for real-time governance. The platform’s Extend Builder further accelerates innovation by enabling customers and partners to develop custom applications directly on the Xactly ecosystem.
Anaplan
Anaplan leverages its Hyperblock architecture to power real-time planning and simulation across quota setting and commission management. Anaplan’s Sales Performance Management and Incentive Compensation Management modules are now augmented by the AI Accelerator program, which brings machine-learning recommendations into forecasting workflows. Rather than pursuing inorganic growth, Anaplan is focusing on strategic partnerships with data science firms to enrich its generative and predictive capabilities while maintaining platform agility and scalability.
NiCE
NICE Systems integrates incentive compensation into its broader portfolio of CX and workforce optimization solutions. Its NICE Incentive Compensation Management platform now incorporates real-time analytics and AI-driven compliance monitoring, leveraging Enlighten AI and Agentic AI pilots to deliver personalized sales guidance. As NICE continues to invest in conversational and generative AI, it is extending the reach of service-centric revenue operations across global sales teams.
Varicent
Varicent’s Incentive Compensation Management offers scenario simulation and what-if modeling powered by its GenAI Assistants, which deliver actionable insights to uncover revenue opportunities and optimize territory alignment. A strategic partnership with ServiceNow extends Varicent’s planning and incentive suite into broader workflow ecosystems, enabling real-time execution across CRM and back-office systems. The company supports its product roadmap with targeted R&D investments and ecosystem integrations, reinforcing its cloud-native compensation platform’s flexibility and scalability.
Conga
Conga, with its unified Conga Advantage Platform, delivers a cohesive quote-to-cash experience by integrating Conga CPQ (formerly Apttus CPQ), CLM, and billing capabilities. AI-powered pricing and discount recommendations are coupled with generative document automation to speed up deal closure. The acquisition of Contract Wrangler in December 2024 and a deeper collaboration with AWS underscore Conga’s strategy to enhance contract intelligence and automation across enterprise systems.
Vendavo
Vendavo is modernizing its CPQ suite with Vendavo Intelligent CPQ, which applies real-time market and competitor intelligence alongside ML-driven recommendations for pricing, bundling, and discounting. Its Pricing Science Initiative continues to drive innovation in predictive margin optimization and adaptive deal guidance. Vendavo also expands its reach through strategic partnerships with major ERP and CRM vendors, while selectively acquiring niche pricing solutions to strengthen its enterprise offering.
Oracle
Oracle has embedded conversational AI assistants into its Sales Performance Management and Incentive Compensation solutions, enabling users to access plan reviews and compensation trends through natural language. Its Oracle CPQ Cloud—originating from the BigMachines acquisition—now includes predictive deal scoring and automated approval workflows. Oracle’s internal GenAI Innovator Program is a key driver of AI-led enhancements, ensuring a unified and forward-looking approach to revenue operations across its Fusion Cloud suite.
ARTW Technographics Platform: SPM customer wins
Since 2010, our research team has been studying the patterns of the SPM software purchases, analyzing customer behavior and vendor performance through continuous win/loss analysis. Updated quarterly, the ARTW Technographics Platform provides deep insights into thousands of SPM customer wins and losses, helping users monitor competitive shifts, evaluate vendor momentum, and make informed go-to-market decisions.
List of SPM customers
Source: ARTW Buyer Insights Technographic Database
Custom data cuts related to the SPM Applications market are available:
- Top 60+ SPM Applications Vendors and Market Forecast 2024-2029
- 2024 SPM Applications Market By Industry (21 Verticals)
- 2024 SPM Applications Market By SPM Segments and Categories
- 2024 SPM Applications Market By Country (USA + 45 countries)
- 2024 SPM Applications Market By Region (Americas, EMEA, APAC)
- 2024 SPM Applications Market By Revenue Type (License, Services, Hardware, Support and Maintenance, Cloud)
- 2024 SPM Applications Market By Customer Size (revenue, employee count, asset)
- 2024 SPM Applications Market By Channel (Direct vs Indirect)
- 2024 SPM Applications Market By Product
Worldwide Enterprise Application Market
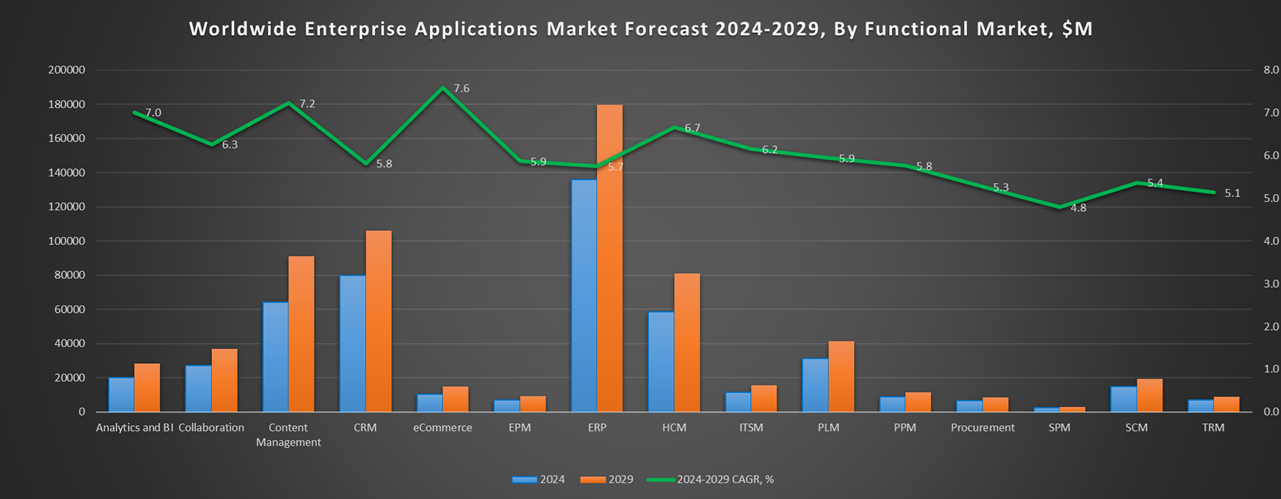
Exhibit 3 provides a forecast of the worldwide enterprise application market from 2024 to 2029, highlighting market sizes, year-over-year growth, and compound annual growth rates across various functional segments. The data shows strong growth in emerging areas like Content Management, eCommerce, Human Capital Management, and IT Service Management, while traditional segments like ERP and CRM continue to dominate in market size.
Exhibit 3: Worldwide Enterprise Application Market Forecast 2024-2029 by Functional Market, $M
Source: Apps Run The World, July 2025
Exhibit 4 shows the enterprise applications market by functional area. The highest growth functional markets revolve around smaller segments like Analytics and BI, eCommerce, Enterprise Performance Management, where first movers remain less established than those that for decades have been entrenched in functional areas like ERP, HCM, CRM and PLM.
FAQ – APPS RUN THE WORLD Top 10 Sales Performance Management Software Vendors, Market Size & Forecast
Q1. What is the global SPM software market size in 2024?
A: The global Sales Performance Management software market was $2.4 billion in 2024, growing 11.5% year-over-year.
Q2. Who are the top 10 SPM software vendors in 2024, and what share do they hold?
A: The top 10 vendors include SAP, Salesforce, PROS Holdings, Xactly, Anaplan, NiCE, Varicent, Conga, Vendavo, and Oracle, together accounting for 57.8% of the market.
Q3. Which vendor leads the SPM software market in 2024?
A: SAP leads the market with about 12.5% market share in 2024.
Q4. What is the forecast for the SPM software market through 2029?
A: The SPM software market is projected to reach $3.0 billion by 2029, up from $2.4 billion in 2024, with a 4.8% CAGR.
Q5. What functionality does the SPM market include in this report?
A: It includes incentive compensation programs, territory and quota management, account segmentation and scoring, deal and quote management, and related workflows for inside, outbound, and channel sales teams.
Q6. What percentage of the SPM market is outside the top 10 vendors?
A: Vendors beyond the top 10—such as Microsoft, Optymyze, Performio, Wanting Systems, and others—represent about 42.2% of the market.
Q7. When was this SPM report published and by whom?
A: The Top 10 SPM Software Vendors, Market Size & Forecast 2024–2029 report was published in July 2025 by APPS RUN THE WORLD analysts Albert Pang, Misho Markovski, and Mihael Trifunovski, as part of the APPS TOP 500 research program, which benchmarks the revenues and market share of the world’s 1,500+ largest enterprise application vendors.
More Enterprise Applications Research Findings
Based on the latest annual survey of 10,000+ enterprise software vendors, Apps Run The World is releasing a number of dedicated reports, which profile the world’s 1,500 largest Enterprise Applications Vendors ranked by their 2024 product revenues. Their 2024 results are being broken down, sorted and ranked across 16 functional areas (from Analytics and BI to Treasury and Risk Management) and by 21 vertical industries (from Aerospace to Utility), as shown in our Taxonomy. Further breakdowns by subvertical, country, company size, etc. are available as custom data cuts per special request.
Research Methodology
Each year our global team of researchers conduct an annual survey of thousands of enterprise software vendors by contacting them directly on their latest quarterly and annual revenues by country, functional area, and vertical market.
We supplement their written responses with our own primary research to determine quarterly and yearly growth rates, In addition to customer wins to ascertain whether these are net new purchases or expansions of existing implementations.
Another dimension of our proactive research process is through continuous improvement of our customer database, which stores more than one million records on the enterprise software landscape of over 2 million organizations around the world.
The database provides customer insight and contextual information on what types of enterprise software systems and other relevant technologies are they running and their propensity to invest further with their current or new suppliers as part of their overall IT transformation projects to stay competitive, fend off threats from disruptive forces, or comply with internal mandates to improve overall enterprise efficiency.
The result is a combination of supply-side data and demand-generation customer insight that allows our clients to better position themselves in anticipation of the next wave that will reshape the enterprise software marketplace for years to come.
- Harvard Bus Schl, a United States based Education organization with 8 Employees
- Zoho, a India based Professional Services company with 19000 Employees
- Zeta Japan, a Japan based Media organization with 73 Employees
| Logo | Company | Industry | Employees | Revenue | Country | Evaluated |
|---|
