
Following a tumultuous year, all key performance indicators point to a decelerating trend among top enterprise software vendors as anxious vendors, customers and other key stakeholders brace for a bleak outlook in the post-pandemic era.
Augmenting our decade-long survey of over 3,000 enterprise software vendors with quarterly updates over the past 18 months, ARTW has identified prevailing trends that underscore a deceleration of Cloud adoptions and new software purchases despite the explosive growth of pandemic-induced highfliers like Shopify and Zoom – the former profiting from eCommerce boom and the latter cashing in on massive use of its video conferencing apps. Now the market outlook has turned sour since organic growth was largely missing from many major on-premise and Cloud vendors in 2020, raising concerns that their anemic performance would extend through the forecast period between 2021 and 2025.
On a broader level, the geopolitical risks made even more apparent than ever during the pandemic with the rise of nationalism or even isolationism(both literally and figuratively during lockdowns in many countries) have prompted many enterprise software vendors to take a public stance against inequality, climate change or any other social justice issue that has now been woven into regular tweets, earnings calls and press releases from many tech executives, a welcome development that underscores the societal impact of technology in the 21st century.
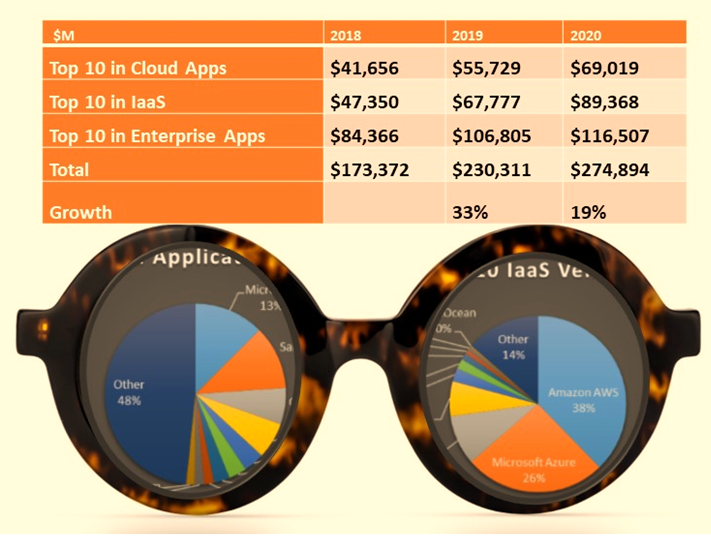
Collectively the top 10 vendors in three major software markets (Cloud applications, enterprise software and Infrastructure As a Service) jumped 33% to reach a total of $230 billion in product revenues in 2019, but they managed to grow only 19% to $275 billion in 2020, as shown in Exhibit 1.
Exhibit 1 – Top 10 Vendors And Their 2018-2020 Product Revenues in Cloud Apps, IaaS, Enterprise Apps, $M
| 2018 | 2019 | 2020 | |
|---|---|---|---|
| Top 10 in Cloud Apps | $41,656 | $55,729 | $69,019 |
| Top 10 in IaaS | $47,350 | $67,777 | $89,368 |
| Top 10 in Enterprise Apps | $84,366 | $106,805 | $116,507 |
| Total | $173,372 | $230,311 | $274,894 |
| Growth | 33% | 19% |
2018-2020 Performance of Top 10 Cloud Applications Vendors
Here are the top 10 Cloud Applications vendors and their product revenues between 2018 and 2020, showing all of them registering double-digit gains in 2020 with particularly steep growth from Oracle at 33%, ServiceNow at 32% and Zoom’s whopping 307% jump, as shown in Exhibit 2.
Exhibit 2 – Top 10 Cloud Applications Vendors and Their 2018-2020 Cloud Revenues Worldwide, $M, and Market Shares in 2020
| Rank | Vendor | 2018 Cloud Revenues, $M | 2019, Cloud Revenues, $M | 2020, Cloud Revenues, $M | Growth, % | 2020 Market Share, % |
|---|---|---|---|---|---|---|
| 1 | Microsoft | Subscribe | Subscribe | Subscribe | 19.5% | Subscribe |
| 2 | Salesforce | Subscribe | Subscribe | Subscribe | 15.0% | Subscribe |
| 3 | Oracle | Subscribe | Subscribe | Subscribe | 32.5% | Subscribe |
| 4 | SAP | Subscribe | Subscribe | Subscribe | 14.7% | Subscribe |
| 5 | Adobe | Subscribe | Subscribe | Subscribe | 27.5% | Subscribe |
| 6 | ServiceNow | Subscribe | Subscribe | Subscribe | 31.7% | Subscribe |
| 7 | Workday | Subscribe | Subscribe | Subscribe | 22.7% | Subscribe |
| 8 | Intuit | Subscribe | Subscribe | Subscribe | 18.5% | Subscribe |
| 9 | Zoom | Subscribe | Subscribe | Subscribe | 306.7% | Subscribe |
| 10 | UKG | Subscribe | Subscribe | Subscribe | 21.3% | Subscribe |
| Subtotal | Subscribe | Subscribe | Subscribe | 23.7% | Subscribe | |
| Other | Subscribe | Subscribe | Subscribe | -5.3% | Subscribe | |
| Total | Subscribe | Subscribe | Subscribe | 7.7% | Subscribe |
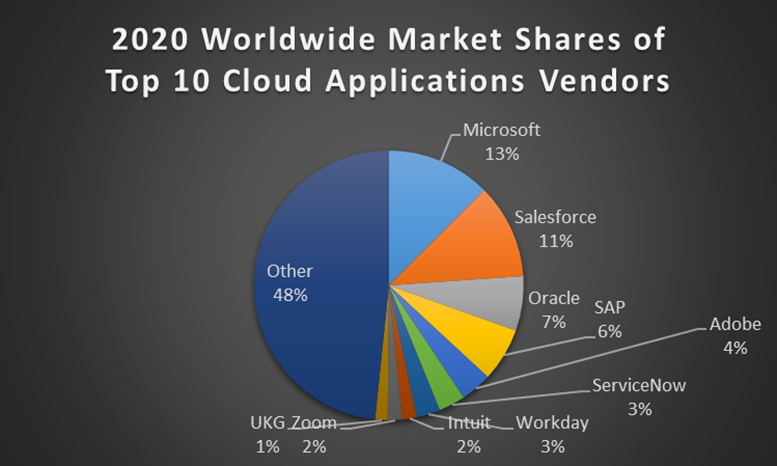
For the third year in a row, Microsoft surpassed Salesforce to become the No. 1 Cloud applications vendor as it extended its lead by aggressively migrating its existing customers and signing new ones to its array of Cloud applications from Office 365 to Dynamics 365, aided by growing use of LinkedIn among recruiters and marketers for its HCM and CRM capabilities. The all-encompassing packaging of Microsoft has also helped the vendor expand into the Cloud collaboration apps market with over 145 million daily active users running Teams now bundled into Microsoft 365 apps.
After buying LinkedIn in 2016 for $26 billion to increase its Cloud applications recurring revenues and leapfrogging Salesforce, Microsoft is in the process of acquiring Nuance for $16 billion. The proposed deal will add about $100 million in Cloud subscription revenues, enriching its collaboration product portfolio with natural language processing and interactive voice response applications from Nuance.
In its defense, Salesforce has been anxious to regain the upper hand in Cloud applications through expensive acquisitions such as buying Tableau for $16 billion for on-premise and Cloud analytics in 2019. In December 2020, Salesforce offered to buy Slack for chat-based collaboration at a steep price of $28 billion, $2 billion more than what Microsoft paid for LinkedIn. Slack’s fiscal 2021 revenues jumped 43% to $903 million, compared with a 57% increase to $630 million in the year-earlier period. By comparison, LinkedIn’s run-rate was about $3.7 billion in 2016, growing at 29%.
The arms race between Microsoft and Salesforce demonstrates the high-stakes gamble tantamount to not just locking in the leadership role, but also preventing any other vendor from closing in. That may stem from the growing realization that any incremental gains – organic or otherwise – in the Cloud applications market is going to be an uphill battle.
Please refer to ARTW’s Taxonomy on the composition of Cloud Applications and our research methodology behind such market-sizing reports.
Exhibit 1a shows the 2020 worldwide market shares of the top 10 Cloud Applications vendors in a pie chart:
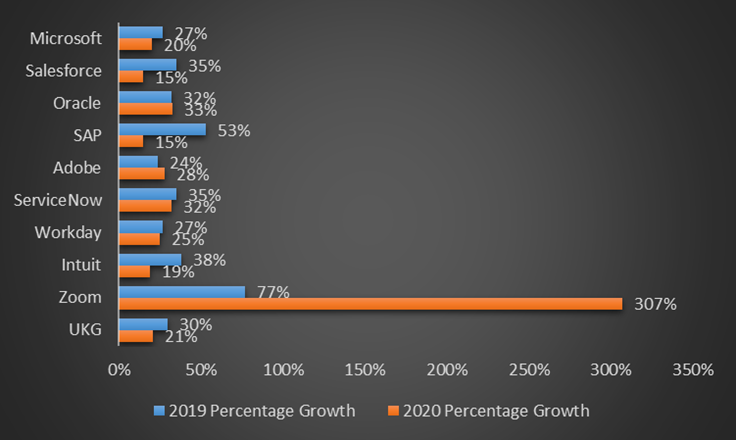
One gets a different perspective when comparing the growth rates of these top 10 Cloud Applications vendors between 2018 and 2020, by percentage and actual dollar.
As shown in Exhibit 3, among the top 10 Cloud Applications vendors, only Oracle, Adobe and Zoom managed to increase their growth rates in 2020 with Oracle and Adobe achieving increasing traction of their Cloud offerings in ERP, HCM and CRM segments. Zoom’s video conferencing applications exploited the Work From Home phenomenon effectively with spectacular results during the pandemic.
Exhibit 3 – Top 10 Cloud Applications Vendors and Their 2018-2020 Percentage Growth, %
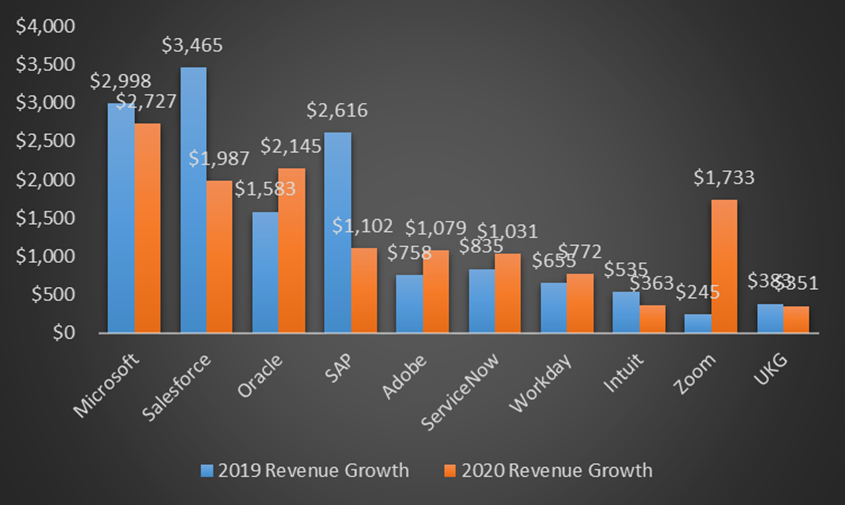
When calculating the actual dollar increases of the top 10 Cloud Applications vendors, Oracle, Adobe, Workday and Zoom were able to post a net increase in product revenues in 2020 over 2019, as shown in Exhibit 4.
Exhibit 4 – Top 10 Cloud Applications Vendors and Their 2018-2020 Revenue Growth, $M
2018-2020 Performance of Top 10 IaaS Vendors
The following table lists the top 10 IaaS vendors and their product revenues between 2018 and 2020, marking their continued successes in helping millions of organizations migrate their applications and other public and private-Cloud workloads (compute, storage, Kubernetes container orchestration and database migration services) to the Cloud as they chalked up nearly a 90% spike in their product revenues during the 36-month period.
Since 2018, both Amazon AWS and Microsoft Azure have gone almost uncontested as the yin and yang of the leading IaaS vendors with the former leveraging its first-mover advantage and eCommerce dominance and the latter catching up quickly because of sizable developer support, not to mention the ease to porting its huge applications workloads into Azure data centers and regions given its expertise in virtualization.
Over the next few years, Amazon AWS’ outsized influence in the IaaS market is not likely to wane given the depth and breadth of its infrastructure, platform and more recently enterprise applications offerings like Amazon Workspace and Connect. Nevertheless, AWS is evolving. First, Andy Jassy, CEO of AWS, will be replaced by Adam Selipsky of Tableau, after the former was tapped to become the new CEO of Amazon as founder Jeff Bezos planned to step down later this year. That alone could result in personnel changes at AWS even though Selipsky used to be a key executive at AWS until 2016 when he left to run Tableau. Despite his familiarity with AWS, Selipsky will have to find new ways to sustain its growth against a competitive landscape different from what he last saw it five years earlier.
Second, the rise of eCommerce to become an essential tool for many buoyed competitors like Shopify, which at one point was a customer of AWS and decided to switch to Google in 2018. Other retailers continue to resist using AWS. Minimizing any large-scale attrition will be a top priority for AWS.
Growing AWS outside the US will face resistance. In early 2021, a Beijing court ruled that Amazon would not be able to use the AWS logo in China, in favor of the AWS trademark held by a local company called ActionSoft. That coupled with the increased momentum of Alibaba and Tencent, which have already raised enough barriers to curb AWS in China and other parts of Asia with their popular payments and chat features. In Europe where AWS as the No. 1 vendor is being closely monitored by regulators with weary eyes, a coalition called GAIA-X covering 22 French and German companies at its core and 500 others through different affiliations across the continent has been formed to build a federated data infrastructure that ensures secure data sovereignty.
Third, AWS has enjoyed a wide berth as the preferred IaaS vendor among at least 50% of the 2,000 largest companies around the world, according to our Buyer Insight Master Database. But many of these customers are also running Azure or other IaaS provider as they pursue a multi-cloud strategy in order to mitigate risks. After seizing an early lead in IaaS, AWS will face a daunting task to prevail at the end.
Fourth, the aggregated number of customers rely on the top 10 IaaS vendors is estimated to stand somewhere between 10 and 15 million including overlapping ones. That is a fraction of the number of software developers worldwide estimating to exceed 50 million and the number of registered companies that tops 165 million worldwide, according to our Buyer Insight Master Database. That means these IaaS providers are chasing after a highly fragmented market that could evolve the same way the PC dominance has been undermined by mobile phones.
Microsoft has been smart enough to adapt by playing to its strengths among developers, despite its stumbles in the mobile phone market. For AWS, the playbook will look and feel a lot different through the forecast period.
Exhibit 5 – Top 10 Vendors for Infrastructure As A Service and Their 2018-2020 Cloud Revenues Worldwide, $M, and Market Shares in 2020
| Vendor | 2018 IaaS Revenues, $M | 2019 IaaS Revenues, $M | 2020 IaaS Revenues, $M | Growth, % | 2020 Market Share, % |
|---|---|---|---|---|---|
| Amazon AWS | Subscribe | Subscribe | Subscribe | 33% | Subscribe |
| Microsoft Azure | Subscribe | Subscribe | Subscribe | 20% | Subscribe |
| Google Cloud Platform | Subscribe | Subscribe | Subscribe | 51% | Subscribe |
| Alibaba | Subscribe | Subscribe | Subscribe | 61% | Subscribe |
| Tencent | Subscribe | Subscribe | Subscribe | 28% | Subscribe |
| Oracle | Subscribe | Subscribe | Subscribe | 119% | Subscribe |
| IBM | Subscribe | Subscribe | Subscribe | 4% | Subscribe |
| SAP | Subscribe | Subscribe | Subscribe | 21% | Subscribe |
| OVH | Subscribe | Subscribe | Subscribe | 20% | Subscribe |
| DigitalOcean | Subscribe | Subscribe | Subscribe | 25% | Subscribe |
| Subtotal | Subscribe | Subscribe | Subscribe | 32% | Subscribe |
| Other | Subscribe | Subscribe | Subscribe | 3% | Subscribe |
| Total | Subscribe | Subscribe | Subscribe | 27% | Subscribe |
Please refer to Exhibit 14 below on the composition of the IaaS vendors, their IaaS offerings and the associated recurring revenue streams, as well as ARTW’s Taxonomy and our research methodology behind such market-sizing reports.
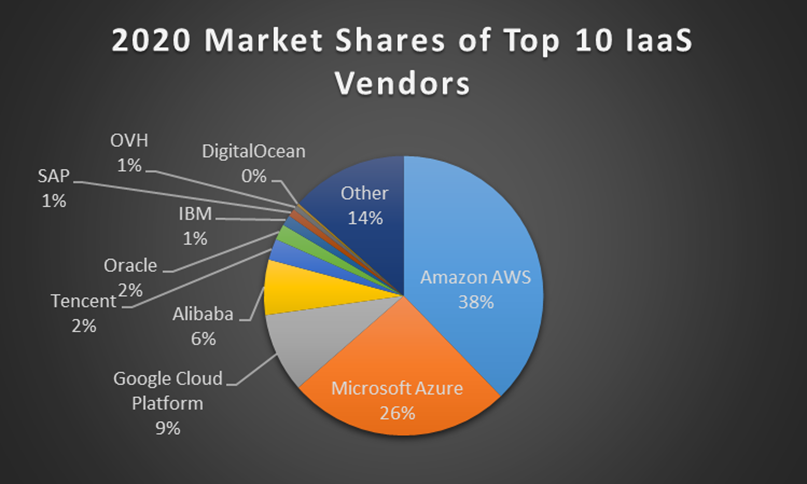
Exhibit 5a shows the 2020 market shares of the top 10 Infrastructure As A Service vendors worldwide in a pie chart:
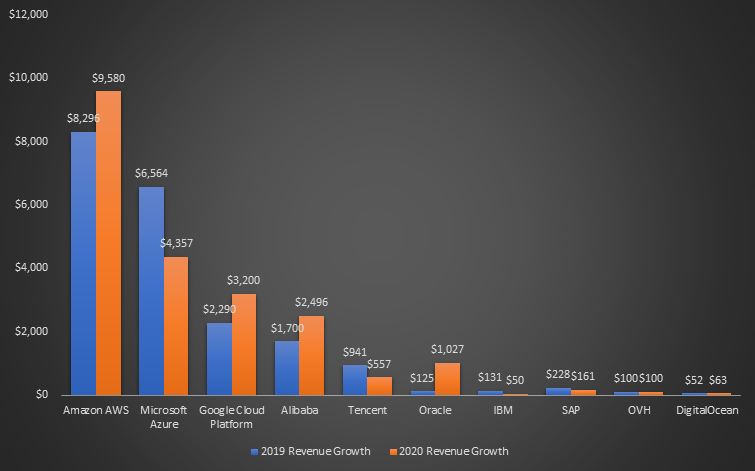
When comparing the growth rates of these top 10 IaaS vendors between 2018 and 2020, by percentage and actual dollar, only Oracle was able to post accelerated increases on both fronts as the vendor expanded its reach by establishing more dedicated data centers and regions, along with the availability of Oracle Cloud Infrastructure in different formats such as Oracle Roving Edge infrastructure, ruggedized devices for edge computing, and Blockchain and machine learning support for Oracle Autonomous Database that runs on OCI, as shown on Exhibits 6 and 7.
Exhibit 6 – Top 10 IaaS Vendors and Their 2018-2020 Percentage Growth, %
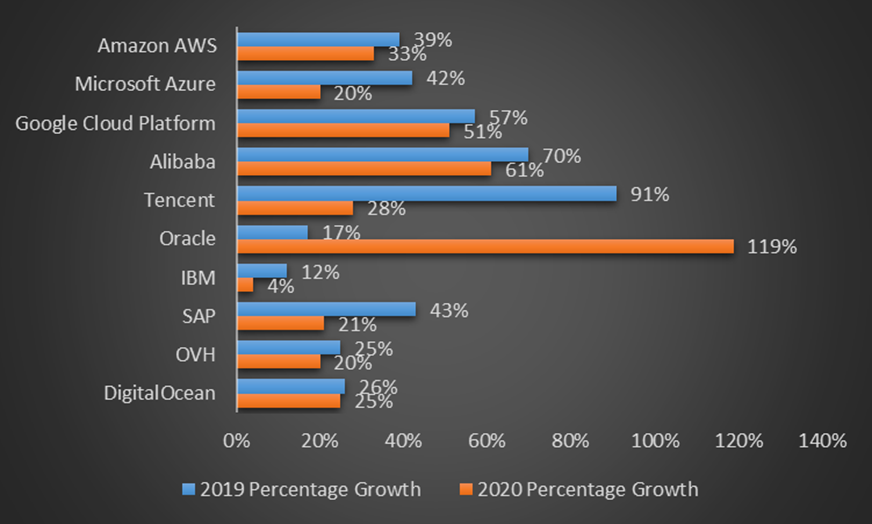
Exhibit 7 – Top 10 IaaS Vendors and Their 2018-2020 Revenue Growth, $M
2018-2020 Performance of Top 10 Enterprise Applications Vendors
The deceleration trend was particularly evident in the enterprise applications market(which includes both on-premise and Cloud software per our taxonomy) with the top 10 vendors growing at 9% in 2020, compared with their 27% increase in 2019. As Exhibit 8 shows, the top 10 vendors saw their growth vacillating anywhere between 1% and 32% in 2020. The overall market went up only 1% to nearly $300 billion, compared with a 4% rise in 2019.
Much of the growth of the top 10 enterprise applications in 2020 was attributable to acquisitions. For instance, Tableau contributed $1.5 billion to Salesforce’s revenues in 2020 after it was bought in 2019 and Medidata boosted the top line of Dassault after its purchase by the PLM apps vendor in 2019, bringing with it clinical trial management products for the life sciences vertical just in time during the pandemic.
Among the top 10, ServiceNow grew the most in 2020 in part because of its ability to expand into new markets like HR Service Delivery after carving out its niche in IT service management. It too made four tucked-in acquisitions between 2019 and 2020.
Exhibit 8 – Top 10 Enterprise Applications Vendors and Their 2018-2020 Product Revenues, $M, and Market Shares in 2020
| Vendor | 2018 Enterprise Applications Revenues, $M | 2019 Enterprise Applications Revenues, $M | 2020 Enterprise Applications Revenues, $M | Growth, % | 2020 Market Share, % |
|---|---|---|---|---|---|
| Microsoft | Subscribe | Subscribe | Subscribe | 6% | Subscribe |
| Salesforce.com | Subscribe | Subscribe | Subscribe | 19% | Subscribe |
| SAP | Subscribe | Subscribe | Subscribe | 1% | Subscribe |
| Oracle | Subscribe | Subscribe | Subscribe | 4% | Subscribe |
| Adobe | Subscribe | Subscribe | Subscribe | 14% | Subscribe |
| Intuit | Subscribe | Subscribe | Subscribe | 12% | Subscribe |
| Dassault Systemes | Subscribe | Subscribe | Subscribe | 13% | Subscribe |
| FIS Global | Subscribe | Subscribe | Subscribe | 4% | Subscribe |
| ServiceNow | Subscribe | Subscribe | Subscribe | 32% | Subscribe |
| Workday | Subscribe | Subscribe | Subscribe | 20% | Subscribe |
| Subtotal | Subscribe | Subscribe | Subscribe | 9% | Subscribe |
| Other | Subscribe | Subscribe | Subscribe | -4% | Subscribe |
| Total | Subscribe | Subscribe | Subscribe | 1% | Subscribe |
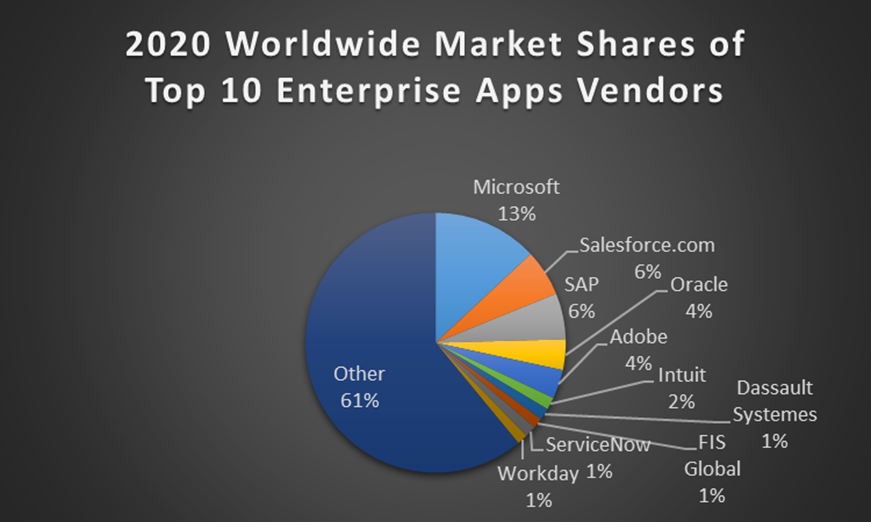
Exhibit 8a provides the market shares of the top 10 enterprise applications vendors in 2020, putting the fragmented market into sharper focus with thousands of vendors below the top 10 thresholds vying for a slice of the $300-billion market. Many of them barely grew in 2020.
Exhibit 8a – Top 10 Enterprise Applications Vendors and Their 2020 Market Shares
None of the top 10 enterprise applications vendors were able to muster accelerated growth rates and net dollar increases between 2018 and 2020, as shown in Exhibits 9 and 10.
Exhibit 9 – Top 10 Enterprise Applications Vendors and Their 2018-2020 Percentage Growth, %
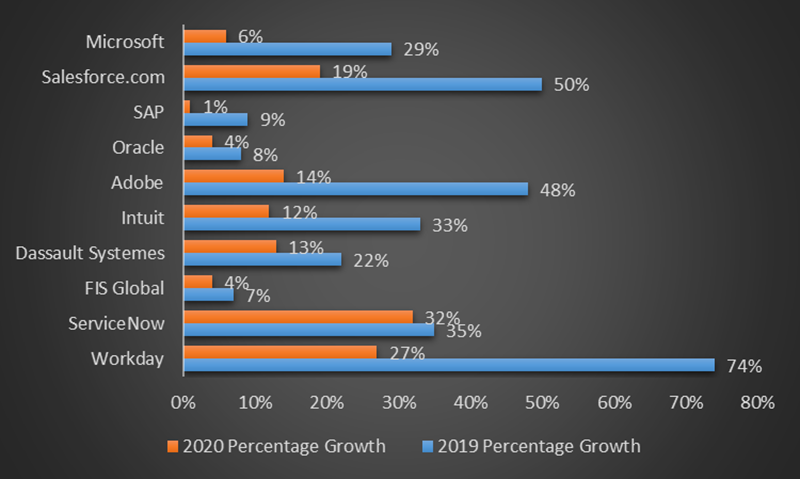
Exhibit 10 – Top 10 Enterprise Applications Vendors and Their 2018-2020 Revenue Growth, $M
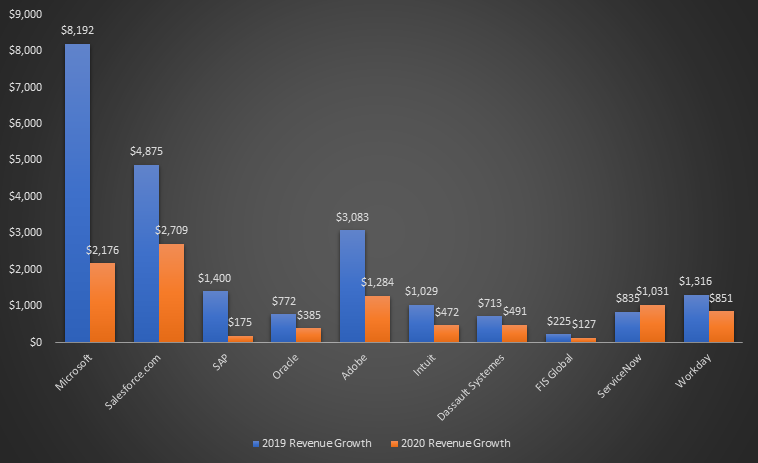
Their deceleration is a telling example of how 2020 has turned the business models of many of these software vendors upside down with most experiencing declines in their professional services revenues because of travel restrictions. For example, SAP’s professional services revenues tumbled 10% in 2020 and IBM’s Global Business Services mostly for software implementations fell 4% last year.
Relying on an army of highly-compensated field salespeople, the direct-business model of most enterprise software vendors could be upended by the remote work shift. Even if travel regulations are lifted in the second half of 2021, any salesperson or manager would probably have to think twice before jumping on an airplane or driving for hours for a 30-minute meeting with a prospect, a decades-old business ritual that is now being reexamined by everyone involved.
A Healthcare IT Paradox Amid the Pandemic
Cerner, one of the largest healthcare software vendors, also saw its professional services revenues decreasing 3%, while experiencing a 2% drop in its software sales at $2.1 billion in 2020. Total revenues at Cerner also fell 3% in 2020 as it spun off its RevWorks services business to R1 RCM last year.
At a time when healthcare was supposed to be the focal point for many, healthcare IT was at a crossroads in 2020 after years of dramatic growth because of increased spending on tools like electronic healthcare records by governments and integrated delivery networks.
Over the past year, some healthcare providers have either postponed or canceled their IT projects as the pandemic dealt a blow to their business models with emergency care overwhelming their operations that left fewer elective procedures being completed.
Allscripts, another major healthcare software vendor, reported a 9% drop in software revenues to $914 million in 2020, citing delays in deals with upfront software revenue and reduced sales to its clients as patient volumes were lower for most of its clients. Allscripts serves more than 175,000 hospitals and physicians primarily in the US.
Nuance, which is currently being acquired by Microsoft, now banks on its Cloud hosting business to help hospitals and physicians incorporate voice recognition apps for transcription and IVR. That business grew 5% to $784 million in fiscal 2020, followed by a 14% jump to $167 million in 1QFY21 ended on December 30, 2020. Meanwhile, Nuance’s on-premise software business shrank 12% to $703 million over the past 15 months.
At the same time, Oracle announced that healthcare customers including Mount Sinai Hospital, NorthBay Healthcare, Inspira Health, proceeded with their large-scale Cloud ERP and HCM applications purchases and implementations over the past year, adding that the IT operations were spearheading these initiatives in solidarity with their counterparts on the frontline to tackle the pandemic by striving to make their business processes much more efficient.
The longer the pandemic is going to drag on, the more likely that the healthcare vertical may be sputtering as on-premise software projects are being delayed or scrapped, while any gain in Cloud services may not be able to rescue the full decline because the former still accounts for the bulk of the spend among healthcare providers.
Troubles Among Enterprise Software Companies
That has already spelled troubles among many enterprise applications vendors still relying heavily on on-premise sales as they found organic growth largely missing in 2020. For example, Constellation Software, which specializes in vertical ERP apps in government, construction and manufacturing, reported a 3% drop in organic growth in 2020, which was offset by its insatiable appetite for expansion through acquisitions that helped the Toronto company to post a 14% rise in total revenues reaching $4 billion last year.
Even though the 11th-ranked Constellation Software has become one of the top software companies in North America, it accepted $40 million in grants in 2020 from different government authorities as part of their efforts to help prop up distressed companies during the pandemic.
The juxtaposition is jarring given that Constellation Software’s stock price has soared 59% since March 2020, now sporting a market cap of $25 billion.
Artificial intelligence software vendor C3 ai, which went public in September 2020, now carries a market cap of nearly $6 billion, first accepted $6.3 million under the Paycheck Protection Program, or PPP loan, from the US government’s Small Business Administration during the pandemic and then repaid the loan in August 2020. Prior to the pandemic, C3.ai had raised $228 million in multiple rounds of funding.
Constellation Software and C3 ai were not alone in using government subsidies to ride out the pandemic. According to SBA data, at least 2,778 software companies in the US applied for PPP loans last year, including the likes of Fuze, Evernote, DYN365, Ironnet Cybersecurity, and G2. These six firms had raised a total of $1.3 billion prior to March 2020.
Exhibit 11 – Enterprise Software Companies’ Survival Tactics During the Pandemic
| Amount of PPP Loan Applied | Amount of Capital Raised Prior To March 2020 | |
|---|---|---|
| C3 AI | $6.3 million | $228.5 million |
| DYN365 | Between $5-10 million | $127.9 million |
| Evernote | Between $5-10 million | $290.0 million |
| FUZE | Between $5-10 million | $480.4 million |
| G2 | Between $5-10 million | $100.8 million |
| Ironnet Cybersecurity | Between $5-10 million | $110.5 million |
While the length that these well-funded enterprise software companies would take to stay afloat might be an extreme illustration of their anxiety levels consistent with many others just to survive the calamity, it does raise the question about their fit to stay, or raison d’être.
Unlike the 2008 financial crisis, the pandemic has not left a lot of enterprise software vendors in dire straits. The most notable one was Skillsoft’s brush with bankruptcy protection. After quickly exiting Chapter 11 in September 2020, two months after its filing and shedding $1.5 billion in debt, Skillsoft was picked up by investor Michael Klein and Churchill Capital – his investment vehicles that include a number of blank-check companies that combined it with Global Knowledge to create a major force in eLearning. Although the future of Skillsoft appears to be secure, the merger has intensified the hunt for competitive upgrades or replacements among eLearning customers, especially those that are running the LMS from Skillsoft and content catalogs from both.
Last year also spawned other troubling signs and lingering effects. The 2020 collapse of Wirecard AG, one of the most promising startups in Germany that went into insolvency after an accounting scandal that centered around $2.7 billion missing from its books. The scandal has already sparked legislative proposals to improve audit quality, but in response Luka Mucic, CFO of SAP, has joined 30 other CFOs in Germany to speak out against the government proposals, fearing such compliance rules would actually raise costs and stifle competition.
Meanwhile, Robert Brockman, CEO of Reynolds and Reynolds, one of the largest automotive dealer management applications vendors, has been accused of concealing $2 billion in capital gains income in the largest tax fraud scheme in history, according to the IRS. The long-term implication is far from clear because of a protracted legal fight that ensues following revelations of Brockman’s decades-long partnership with Robert Smith, founder and CEO of Vista Equity Partners, one of the most successful investors behind enterprise software vendors like Reynolds and Reynolds, Marketo, Wrike, and more recently Pipedrive, after Smith agreed to help IRS indict Brockman.
Any uncertainty is not conducive to turn around the global economy as it slips perilously close to a full-blown downturn despite numerous government interventions. ARTW is still assessing the situation to determine whether to pull back our market forecast. For the time being, the following offers our latest forecast on the Cloud applications space, which will be updated with projections for other markets in the coming months.
Rosy Outlook Turns Cloudy
Despite a lack of consensus on what constitutes an end to the current pandemic, there is little doubt that some enterprise software companies will fare significantly better than others. The adage that a rising tide will lift all boats may not hold true anymore because of the considerable damage that the public health crisis has inflicted on sectors like airlines, entertainment, leisure, hospitality and retail.
In the post-pandemic era, which could range any time between 2021 and 2025, the enterprise software market will have little to learn from past experiences because of the uneven performance of many during 2020.
Zoom, Shopify, and DocuSign were among the beneficiaries over the past year registering total revenue hikes of 326%, 86%, and 49%, respectively, adding a combined $3.7 billion in incremental sales from 2019 to 2020. On the flip side, Amadeus and Sabre, the two biggest enterprise applications vendors providing computer reservation and property management systems to airlines and hotels, saw their total revenues plummet 61% and 66%, respectively in 2020, erasing $6.3 billion in sales between them from 2019 to 2020. That does not even include the travails of the third largest vendor in the travel management software market Travelport, which received $1 billion in funding from a group of investors in June 2020 after the airline and hotel industries went into a cardiac arrest three months earlier.
The bottom line is that new Cloud subscriptions paid by millions of first-time users of Zoom, Shopify and DocuSign in 2020 were woefully inadequate to cover the lost transaction, license and maintenance fees that Amadeus, Sabre and Travelport would not be able to recover from their customers in the future.
Exhibit 12 shows our forecast for Cloud applications through the forecast period, an exercise that will be continuously updated for ARTW clients throughout 2021.
Exhibit 12 – Cloud-Based Enterprise Applications Market Forecast, 2021-2025, By Functional Market, $M
One of the biggest inhibitors to growth for Cloud applications has to do with the high unemployment rates that could persist through the forecast period in the United States and other countries still struggling to contain the pandemic, or for that matter deliver essentials to their populace.
With fewer people in the workforce comes reduced need for expensive software or even Cloud software seats on a per user per month basis.
Another inhibitor is the announced capital expenditures reductions by some of the biggest companies – notably Apple and Aramco – with the former cutting $5 billion to boost cash flow in 2020 and the latter dropping its capex by as much as $10 billion in 2021 because of low oil prices. In November 2020, a Bain study concluded most industrial companies reduced their spending on R&D and capital expenditures last year.
Again, in the post-pandemic era bolstered by artificial stimulus programs from nervous governments and loose monetary policies from generous central banks, market distortions – manifested in fluctuating prices on everything from toilet paper to hand sanitizer and from bitcoin to Non Fungible Tokens – are pushing risk-taking to a new level.
Over the past two decades, there have been three major public health crises(SARS in 2002, Ebola in 2013 and Covid-19 in 2020). Some may take comfort that these events do not happen often, but the current risk-on mentality may well be one of the lasting impacts of the pandemic, a curse for many and perhaps a blessing for others.
For example, government ERP heavyweight Tyler Technologies launched its biggest acquisition in February 2021 by agreeing to pay $2.3 billion for NIC Solutions, which offers similar products like payment processing for public sector agencies to collect fishing license and motor registration fees.
Despite the similarities, Tyler forges ahead with the opportunistic purchase in order to take advantage of using NIC’s eGov portal to run Covid testing programs for state governments through a new product called TourHealth, which has already signed five states including Florida, South Carolina, Kansas, in addition to Alabama Department of Corrections and the University of Mississippi. In August 2020, NIC started selling TourHealth by working with partners that carried out Covid testing and the subsequent contracts netted the vendor $62 million, or nearly 48% of its software and services revenues last year, a revenue source that did not even exist in 2019. Without TourHealth, NIC would have posted a 7% drop in business in 2020.
SPAC Soft-pedals Software Risks
Then there is the rise of Special-Purpose Acquisition Company(SPAC), which has provided an easy path for companies to go public without the restrictions normally extended to pre-IPO entities. By merging with a SPAC, many companies including DraftKings, Virgin Galactic, Nikola Motor and a number of enterprise software vendors have gone public over the past year and the regulators are asking tough questions, especially on the propriety of issuing rosy forecasts during the merger proceedings, something that was prohibited in a typical IPO process. The same applies to such SPAC-led mergers and their treatment of warrants, which may now have to be considered liabilities, rather than equity instruments and thusly depressing the company value.
In April 2021, the US Securities and Exchange Commission released a statement saying that “with the unprecedented surge (in SPAC activities) has come unprecedented scrutiny.’’
In October 2020, E2Open, which specializes in supply chain management apps, was acquired by CCNB1, a SPAC, and it went public in early 2021 as it projected a 10% organic growth for latest fiscal year. Its shares have remained largely unchanged since its IPO.
A more rosy forecast came from eLearning apps vendor Skillsoft, which filed for Chapter 11 in July 2020, exited bankruptcy protection in September, combined itself with corporate training company Global Knowledge at the same time after their merger with Churchill Capital, a SPAC, and more recently announced its plan to go public with a projected revenue growth of up to 2% in 2021 and as much as 10% in 2022. That contrasts with a 19% drop in Skillsoft’s revenues for the nine-month period ended October 31, 2020. Similarly, Global Knowledge saw a 20% drop in its revenues in its fiscal year ended October 2, 2021. It is quite possible that the combination of Skillsoft and Global Knowledge would yield the synergistic benefits and the upside potential. However, any forecast of that sort would not be found in a regular IPO filing.
Even some enterprise applications vendors are questioning the merits of these SPACs. As CEO of Zoho, one of the fastest growing CRM vendors in India, Sridhar Vembu – no stranger to risk-taking himself – offered the following observation during his presentation at the February 2021 Zoho One event.
Exhibit 13 – Zoho CEO Sridhar Vembu’s presentation during Zoho One in February 2021

One of the biggest differences between 2021 and 2000 when the Dot Com bubble burst is the tech world has become more of a giver than a taker. Whereas greed was deemed good and admirable back in 2000, the world today calls for a new corporate mandate and perhaps a fundamentally different way to measure growth, success and long-term viability.
As a result, the deceleration cited in the beginning of this report does not necessarily suggest that the Cloud marketplace is a zero-sum game because there are larger forces at play as vendors large and small are assuming a proactive role in helping to address issues like inequality, race relations and sustainability. The reckoning of the importance of social good may well be the only redeeming value to the pandemic, perhaps fostering a more profound and positive impact on the technology industry and the world for years to come.
Exhibit 14 – Composition of the top 10 IaaS Vendors, their Iaas Offerings and the Associated Recurring Revenue Streams By Cloud Segment
| IaaS Vendor | Cloud Offerings | Products and Services |
|---|---|---|
| Amazon AWS | AWS IaaS | EC2 Virtual Servers, ECS, Dockers, AWS Scalability, Elastic Load Balancing, VM Compute, S3 Storage, Security, RDS Relational Database, etc. Professional Services revenues associated with AWS IaaS are excluded. |
| Amazon AWS | AWS PaaS | Amazon Aurora, Dynamo DB, Redshift |
| Amazon AWS | AWS SaaS | Amazon Connect, Amazon Workspaces, Alexa for Business, Amazon Chime, Amazon WorkDocs, Amazon WorkMail |
| Microsoft | Microsoft Azure IaaS | ARTW modeling calls for Microsoft Azure IaaS revenues that are based on standalone Azure revenues from external customers other than those attributable to Office 365, Dynamics 365, and other Microsoft Commercial and consumer Cloud revenues. |
| GCP IaaS | Google Cloud Platform – Compute Engine, Cloud Storage, Containers(Google Kubernetes Engine), Cloud Bigtable, Cloud Memorystore, Security, etc. Google Consulting and Professional Services revenues associated with GCP are excluded. | |
| GCP PaaS | Anthos, Apigee, Bebop, Firebase, Looker | |
| GCP SaaS | GSuite, Google Maps Platform, Orbiterra, Google Workspace | |
| Alibaba | AliCloud IaaS | ARTW modeling calls for elimination of PaaS and SaaS revenues from AliCloud. Professional Services revenues are also excluded. |
| Tencent | Tencent Cloud | ARTW modeling calls for elimination of PaaS and SaaS revenues from Tencent. Professional Services revenues are also excluded. |
| Oracle | Oracle Cloud Infrastructure | OCI revenues are based on historical trends and percentage increases announced by vendor during quarterly earnings proceedings. |
| IBM | IBM Cloud | IBM IaaS revenues are derived from its GTS segment, specifically a portion of its Infrastructure and Cloud Services with quarterly Cloud percentage increases announced by vendor during quarterly earnings announcements. IBM IaaS revenues more than doubled in 2014 following its acquisition of SoftLayer, which brought with it more than 21,000 customers. |
| SAP | SAP Cloud Platform as part of SAP Business Technology Platform | Derived from IaaS revenues announced by vendor during quarterly earnings proceedings. |
| OVH | OVHcloud | Derived from OVH’s multiple infrastructure offerings and 27 data centers that support Cloud hosting needs of more than one million customers following its acquisition of VMWare’s vCloud Air Business in 2017. |
| DigitalOcean | Droplets and Managed Kubernetes service | Planning to raise more than $892 million in an IPO, DigitalCloud has more than 570,000 customers in 185 countries running Droplets and Managed Kubernetes and database services. |
Research Methodology
Data used in research reports are derived from publicly available documents, continuous surveys of applications vendors, customers, resellers, Independent Software Vendors, systems integrators and other verifiable sources.
Vendor shares and market forecast results are based on a combination of existing databases as well as demand side and supply side research conducted throughout the year with validation from vendors, customers, channel partners and documentations such as earnings releases and 10Q and 10K filings, vertical industry studies, regional and country-level statistics from public and private institutions(i.e. colleges, universities, government agencies and trade associations).
For additional information on our methodologies, here’s the link:
