
Trusted Source for Technographic Data, Buyer Intent, Demand Generation, and Applications Research
Since 2010, Apps Run The World has grown rapidly to become one of the most popular and trusted data sources for real-time enterprise technology market insights driven by supply-side research and millions of software purchases that are being updated daily.
In 2024, we instituted new pricing options by offering a range of new and improved benefits including expanded data downloads, research credits, ondemand leads, buyer intentions, inquiry hours, and referrals to subscribers, depending on their membership levels.
This page details the benefits for our subscribers as well as other commonly asked questions.
For any subscriber who has signed up with us prior to April 2024, your access privileges will remain the same and they will stay intact in perpetuity as long as the subscription is kept active in every renewal cycle. Some of those new and improved benefits could be made available to subscribers under their existing membership plans. The alternative is for them to upgrade to the new plans and enjoy all of the above benefits wherever applicable. The choice is theirs.
Define Buyer Intent
Thousands of unique visitors access ARTW content every day with increasing numbers of them originating from end user organizations(Buyers) around the world. Leveraging our internal IT resources and off-the-shelf CRM tools, we are able to de-anonymize and identify these end-user organizations. ARTW does not store, nor do we have visibility into our visitors’ IP addresses. We process the buyer intent signals in compliance to privacy rules and regulations such as GDPR. You can also view our privacy stance here.
Our buyer intent data repository amounts to actionable forward looking signals that can help our clients gauge the interest levels of these Buyers that are either evaluating or actively looking for replacements to their current software products, as we have already documented their existing technology stack as part of our demand-side research that forms the basis of our Buyer Insight Technographic Database.
In short, total visibility into the Buyer mindset is what we are capable of delivering:
Historical Purchases + Forward Looking Intentions = Future Direction
Summarize Buyer Intentions
Generally, Buyers visit our premium content with the following intentions:
#1 Evaluating tier 1, secondary and alternate software vendors, service providers and implementation partners
#2 Building a business case for benchmarking purposes, especially against peers within same industry
#3 Mitigating risks by first gaining visibility into technology use within own ecosystem of customers and partners
#4 Leveraging buyer insights to expand within target verticals
Activate Actionable Buyer Intent Data
#1 Use filtering function to drill down Buyers by geo, industry, product, etc.
#2 Request referrals and notifications whenever target Buyers manifest themselves
#3 Align go-to market strategy with legacy products from specific vendors as desupport deadlines draw closer
#4 Upgrade to custom research services for building campaigns that fit Ideal Customer Profiles based on anticipated timing of Buyer Intentions
#5 Partner with ARTW to develop differentiated collaterals from special survey reports to digital events to drive further engagement with Buyers
Buyer Intent Signals Are Defined As Forward-Looking Statements
ARTW uses forward-looking statements in its communications to describe its future plans, expectations, and beliefs. Similarly, ARTW’s Buyer Intent Signals are treated as forward-looking statements as they are derived from site visitors and clients that interact with ARTW’s intellectual property continuously and into the future.
These statements including Buyer Intent Signals are subject to risks and uncertainties, and actual results may differ materially. ARTW cautions against placing undue reliance on these statements, which reflect the company’s opinions only as of the date of the statement.
How to make the best use of MultiFilter Access?
It allows subscribers to narrow their search by market, industry, country, company size, etc. When generating results, it will be quicker to do filtering on Customers, Directory, Categories and Reseller tabs because of fewer filters available. However, we add or drop filters continuously based on demands from subscribers.
Why are there PageView Boundaries?
For version control and protection of our IP, every member is entitled to a fixed number of page views daily per one’s membership level. Once you click on a html page, it is considered one page view. On average, paid visitors view anywhere between a dozen and 100+ pages per day. We strictly prohibit scrapping and/or crawling of our site using any automated tools, as described in further detail in our Terms of Service section.
What are Research Credits and how to use them?
Credits are designed to prepare customer profiles not readily available on our site. Each credit is good for one customer profile. For example, does company ABC use Adobe Experience Cloud? If it is not available on our site, our team of domain experts will conduct research on company ABC and return results for subscribers. Results will be made available in separate Excel/CSV/Google formats specified.
Monthly subscribers can request to use all available credits upon activation. Research credits must be tendered during subscription period and they cannot be rolled over. Once they are used up, subscribers can purchase additional research credits similar to our custom data cuts research offerings.
Explain Data Downloads
The self-service download feature is now available to all subscribers. Feel free to contact us and schedule a demo at support@appsruntheworld.com.
Subscribers are entitled to receive a set of customer profiles in Excel, csv, Google Sheets, etc. Contacts are not included. It is a refillable account that allows subscribers to export technographic data of any customer record and its contacts based on number of Data Downloads and Key Stakeholders credits available, whichever comes first. Once they are used up, subscribers can purchase additional Data Downloads similar to our custom data cuts research offerings.
What is the difference between Data Downloads and Key Stakeholders?
They can be combined or used separately to export any number of Data Downloads and Key Stakeholders credits available, whichever comes first.
What do Inquiry Hours cover?
These inquiries cover a range of topics from further market data drill-downs to coverage areas not readily available on our website – meaning they all entail a bit of research time on our side.
Once the Inquiry Hours are used up, subscribers can either upgrade to the next level or buy additional Inquiry Hours.
Can subscribers make ondemand requests?
One of the benefits of the Inquiry Hours is to send us ad hoc requests. We welcome any subscriber to make ad hoc requests for new profiles and key stakeholders to be appended to our site in accordance with ARTW’s update schedule.
How do I transfer my subscription access to another user?
Each subscription is good for one designated user. If for any reason a subscriber wants to transfer the license to another person during the course of the subscription, notifications and authorizations in advance are required. Approvals will be granted on a case by case basis.
Do you actually have data on 500 vendors?
No, we actually have data on more than 15,000 enterprise applications vendors (see taxonomy here). Apps Top 500 sounds better than Apps Top 1509, don’t you think? As the Enterprise Applications market continues to grow, we think the gap between the top 100 vendors and the 1000-1500 vendors that follow is likely to shrink. By that time, we may expand it to Apps Top 5000. Our philosophy has always been inclusive, as opposed to exclusive.
Do vendors have to pay in order to be included?
This is the most common question that we have received because of the tendency of some research firms soliciting fees from vendors for their awards and/or similar market research projects. We do not accept fees from any of the 1,500+ vendors, or any vendor for that matter that wants to be included in our market-sizing reports. If you want to participate in those pay-for-play research projects, we are not for you.
So how do you make money?
Our clients, along with subscribers, pay us in order to access our premium research data, including the full profiles of the Cloud Top 500 vendors as well as valuable resources like a rich database of Cloud customers and their applications environment. We also participate in client-sponsored research projects, but these custom solutions are independent from our published research agenda. Put it simply, we exercise a firm and consistent policy with regards to our market-sizing reports, never ceding the control of the research process and methodology to anyone outside Apps Run The World.
What can paid subscribers expect to get?
Paid subscribers and members have full access to our premium content including millions of web pages that are updated daily or weekly. Each paid subscription and/or membership access to ARTW’s website and its premium content is restricted to a single designated user. Subscribers may not transfer, assign, sub-license, lend, or re-sell the rights granted under this license.
What is your quotation/citation policy?
Every day we receive many requests to republish our market-sizing data as well as our original content. Here are some guidelines:
Anyone that wants to quote, attribute or refer our data and content must obtain our written permission first.
All requests should be directed to research@appsruntheworld.com.
If you want to quote our numbers in a press release or blog post, please send us a draft copy for approval.
Our legal team will persecute to the full extent of the law anyone anywhere around the world for reproducing our copyrighted content without prior authorization.
Do you accept advertisements or sponsorships on your Platform?
We may accept advertisements and/or sponsorships in the future because our traffic from a highly sought-after audience is increasing every day. Today our revenues are primarily coming from paid clients and subscribers.
How do you select the Apps Top 500 vendors?
In our vendor database, there are more than 15,000 software vendors that sell Enterprise applications. We create a company model for each ISV to determine their revenues based on the following components:
- Company earnings, press releases
- Years in Enterprise Applications business
- Number of Enterprise Applications customers
- Number of Enterprise Applications subscribers
- General pricing of its Enterprise Applications offerings from the vendor and its peer group
- Estimates on recurring revenues from Enterprise Applications, Cloud subscriptions, hybrid Cloud, hosting, and managed services
- Customer adoptions of its Enterprise Applications based on our database of 2M+ enterprise customers
- Channel sales through resellers, hosting partners, OEMs, other business partners
- Publicly-available information from third-party sources such as newspapers, blogs, social media, etc.
- Published materials from Apps Run The World and affiliated Super Sites
By applying the above methodology consistently, we have been able to gather detailed revenue data on each of these top 500 vendors.
What do you do with privately-held vendors that do not disclose their revenues?
For privately-held vendors, our approach is consistent. We compare their Enterprise Applications performance with that of their peers and calculate their revenues based on their history of selling, pricing and most importantly their transition to the Cloud from on-premise selling, which typically comes with a great deal of information for us to extrapolate and model. After we compile their revenue data and complete our analysis, we send profiles to vendors for their feedback. Revenue data and profiles in the Apps Top 500 report have all been validated with the vendors before we publish the results.
How often will you be updating the Apps Top 500 list?
Every day we add new materials including updates on vendor profiles and customer records in the Customer Database section. In terms of their ranking, it will be updated annually. We also provide our clients with performance analysis on some of these Apps Top 500 vendors on a quarterly basis.
How can a new company be included in next year’s Apps Top 500 report?
You can provide a brief description of your company and enterprise applications offerings by emailing us at research@appsruntheworld.com and we will get back to you.
Chronology of releases of Apps Top 500, Cloud Top 500, HCM Top 500, Buyer Insight Technographic Database:
May 2010 – Company is founded with a simple idea to harness the most talented people to conduct comprehensive and quantitative research on the enterprise applications market by combining revenue, product and customer data from both supply-side and demand-generation sources.
September 2010 – First set of market-sizing reports on different verticals from banking to utility analyzing top 10 vendors in each market are made available freely on Apps Run The World.
January 2012 – Cloud Top 500 idea is presented to research board
July 2013 – Launch of Apps Run ERP Super Site with profiles of top 100 ERP applications vendors
December 2013 – A preliminary list of more than 2,000 Cloud applications vendors is presented to research board
February 2014 – A list of Cloud Top 500 applications vendors based on their 2011-2013 Cloud subscription revenues is finalized with their profiles being assigned to a global team of analysts and researchers
March 2014 – Launch of Apps Run Treasury Super Site with profiles of top 80+ TRM applications vendors
April 2014 – First batch of Cloud Top 500 profiles completed and sent to vendors for their feedback. Thousands of Cloud and on-premise applications customer records and profiles are being added to the Customer Database in order to validate Cloud adoption trends across different regions and verticals.
May 2014 – 2014-2018 Enterprise Applications market forecast is finalized by region, country, revenue type, functional market and other segments after receiving input from inhouse analysts, vendors, customers and partners, while research report framework is built to focus on total investment funding for Cloud vendors and 2013-2014 mergers and acquisitions that could result in backstreaming of Cloud revenues. Vendor database that covers 2013 revenues is finalized.
June 2014 – Preview of Cloud applications market forecast, vendor and customer data is shared during private sessions with clients.
July 2014 – Remaining profiles with feedback from vendors are being entered into our database. All research documents for Cloud Top 500 are being completed and formatted for Excel and PDF downloads.
August 2014 – Launch of Apps Run The Cloud Super Site with profiles of Cloud Top 500 applications vendors.
August 2015 – New and Improved Apps Run The World Super Site goes live with updated profiles of Cloud Top 500 applications vendors.
June 2016 – Apps Top 500 and Cloud Top 500 Market Reports go live along with 37 Top 10 Reports on scores of functional markets from Analytics to Treasury & Risk Management and vertical industries from aerospace and defense to utility. Win/loss analysis of customer purchases across all these markets is being updated every quarter to Enterprise Applications Buyer Insight Database now covering more than 100,000 end-user organizations around the world.
December 2016 – We end 2016 with a bang as we salute HCM Top 500 Vendors by releasing a 3,000-page+ market report that segments the highly competitive space into 21 verticals and 22 functional areas, all revolving around three major product groups – Core HR, Talent Acquisition and Workforce Management. Improved Apps Run The World Super Site goes live with updated profiles of Cloud Top 500 applications vendors.
January 2021 – Despite the pandemic, our revenues grow 20% in 2020, while the Online Customer Database continues to expand to include over 130,000+ unique purchases from tens of thousands of enterprise applications customers.
January 2024 – ARTW enters a new era with a new and improved user interface and Buyer Insight Technographic Database that covers 10 million+ software purchases made by millions of organizations worldwide.
April 2024 – Optimizing our research support with maximum demand generation impact, ARTW unveils a full spectrum of new benefits for paid subscribers including referrals, access to buyer intent data, expanded data downloads, research credits, ondemand leads, inquiry hours and custom data cuts.
Research Areas
Using a tree metaphor, our research areas start with the aggregation of root records in our proprietary database, which keeps detailed information on more than 3,000 applications vendors.
Each root record forms the basis of a vendor profile, which contains such crucial data as the number of their customers, their key products and shares in any one of the markets that we cover, the structure of their ecosystem as well as an assessment of their strategies using our SCORES methodology.
Each profile of a leading apps vendor gets incorporated into a research report that details the major trends and key events that lead to the overall development of an application market.
Forecast is based on actual and projected demand for applications, supplemented by end user surveys as well as data from a cross section of customers following their announced and repeated purchases as well as the prevailing economic and market conditions.
Data-Gathering and SCORES Research Methodologies
Transparency is the guiding principle in every research report, or any deliverable for that matter, from APPS RUN THE WORLD.
Data used in research reports are derived from publicly available documents, continuous surveys of applications vendors, customers, resellers, Independent Software Vendors, systems integrators and other verifiable sources.
Vendor shares and market forecast results are based on a combination of existing databases as well as demand side and supply side research conducted throughout the year with validation from vendors, customers, channel partners and documentations such as earnings releases and 10Q and 10K filings, vertical industry studies, regional and country-level statistics from public and private institutions(i.e. colleges, universities, government agencies and trade associations).
We conduct the SCORES analysis by using six criteria to compare vendor performance against that of its peer group.
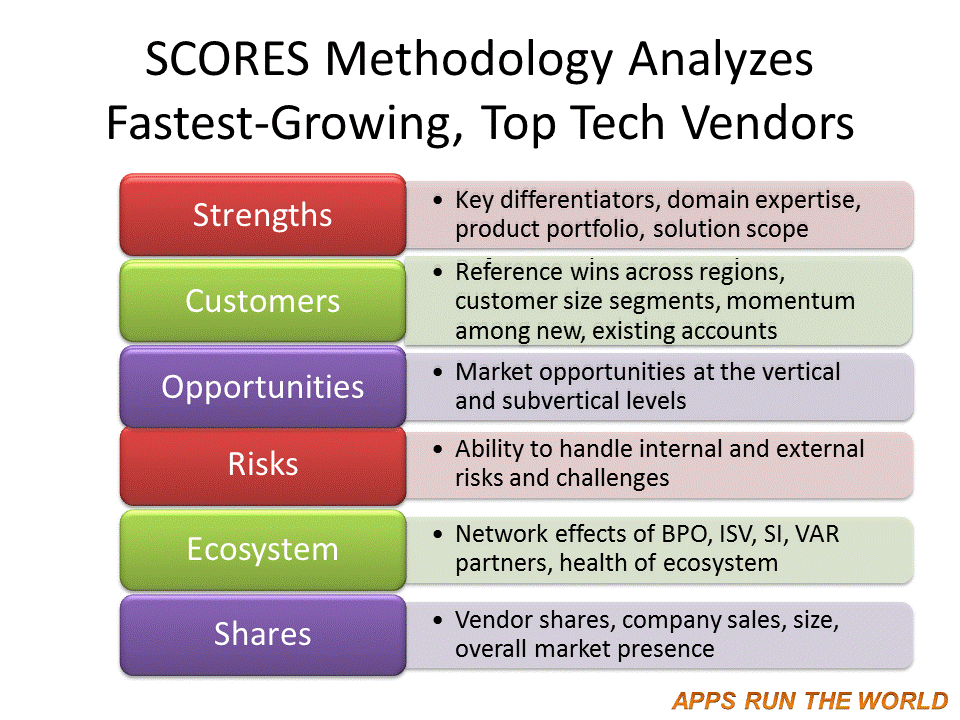
Vendors’ SCORES are rated above average, average or below average to reflect their current and future performance, taking everything within the peer group into consideration.
Ratings that we use to determine APPS RUN THE WORLD SCORES predictive analysis are calculated after examining the strengths of a vendor and its product portfolio, as well as those of its competitors. For example, if a vendor is constantly adding enhancements to its product portfolio at a rate much faster than that of its competitors and the vendor is producing desired results for customers, it’s likely that it would receive an above average rating on its product strength.
Other metrics include quantifiable reference wins in a given quarter or a given year, projected market demand based on current revenue run rates, known and expected risks and a vendor’s ability to tackle them, partner contributions, and actual revenue and projections with guidance from vendors.
