
Today we are releasing Apps Top 500 Market Report, which ranks the combined on-premise and Cloud revenues of the biggest enterprise applications vendors in order to give buyers a fuller picture of the breadth of the $320-billion business software market.
In addition, we are announcing the release of this year’s Cloud Top 500 Market Report, which ranks and analyzes the explosive growth of the world’s 500+ largest enterprise applications vendors ranked by their Cloud subscription revenues.
Just to make things even more interesting, we are releasing 37 market-sizing reports from Analytics and BI to the Utility vertical, focusing on the Top 10 vendors in each of these unique markets. Going forward, for each of the 37 markets our global team of researchers will be updating them every quarter with win/loss analysis of the latest software purchases within that specific market. All of these quarterly data can be found in our Enterprise Applications Customer Database.
Apps Top 500 & Worldwide Enterprise Applications Market
In 2015, the worldwide enterprise applications market rose 3.4% to a record $193 billion in product revenues following a decade of sweeping transformation.
Brutal at times, the unrelenting pace of change has upended the enterprise applications marketplace by fueling the growth of a wide spectrum of upstarts, while prompting incumbents to find ways to reinvent themselves through the Cloud, costly acquisitions as well as business model changes that have yielded mixed results.
Last year was a turning point for enterprise applications vendors as many made drastic measures to combat decelerating growth, structural changes to their business models and in a few exceptional cases deteriorating financial conditions.
Beneath the uncertainty lies the rich promise of securing tens of millions of subscribers who require different applications to run mission-critical processes from accounting to warehouse management, not to mention the billions of dollars their companies are budgeting for digital transformation initiatives designed to give them a leg up their competitors by tapping into new software tools for quicker and easier access to real-time business data and customer insights.
After surveying more than 3,000 enterprise applications vendors continuously through the years, we have identified the top 500 companies that have generated the most product revenues in 2015. You can view the summary market data as follows.
Exhibit 1 – 2015 Enterprise Applications Market Shares Split By Top 10 Vendors, Tiers 2 and 3 and Others, %

Exhibit 1 shows the segmentation of $193-billion in product revenues into four groups: Top 10 vendors led by SAP hold 31.7% share of the 2015 enterprise applications market, Tier 2 which covers vendors that are ranked between 11th spot and 100th spot collectively control 32% of the market, Tier 3 which covers vendors that are ranked below 100th spot have 17% of the market, while other as a group has 19% of the market. The revenue distribution points to the fact that nearly two-thirds of the enterprise applications market are being held by the Top 100 vendors. By comparison, the Top 100 enterprise applications vendors had only 59% of the market in 2014.
Exhibit 2 shows the enterprise applications market split by revenue type between traditional on-premise deployment and Cloud delivery with the former accounting for 75.5% of the market in 2015, down from nearly 80% in 2014. Cloud delivery, on the other hand, grew from 20.6% of the market in 2014 to 24.4% in 2015, continuing its expansion at the expense of conventional software sales.
Exhibit 2 – Enterprise Applications Market Split Between Cloud and On-Premise Implementations, 2014-2015, $M

Exhibit 3 drills down into the enterprise applications market by functional area. You can view the definitions of functional areas by reading our Software Taxonomy here. In addition, you can check out the Top 10 Enterprise Applications Vendors and their profiles in each of the 16 functional markets by accessing our vendor database.
Exhibit 3 – Enterprise Applications Market By Functional Market, 2015, $M

Exhibit 4 offers another view of the enterprise applications market by vertical industry. Each of the 21 vertical industries encompasses product revenues from vendors that either focus on industry-specific applications like claims processing for insurance or from those that target certain verticals with their generic solutions such as selling collaboration applications for project-based organizations in the professional services vertical. You can view the definitions of the 21 vertical industries by accessing our Taxonomy page. Similarly, you can check out the Top 10 Enterprise Applications Vendors and their profiles in each of the 21 vertical industries by subscribing to our vendor database.
Exhibit 4 – Enterprise Applications Market By Vertical Industry, 2015, $M

In addition, our team of researchers have crunched historical data to identify the top 500 enterprise applications vendors in 2006, providing greater visibility into the evolution of the enterprise applications market over a longer period of time in order to fully explain the implications of the underlying changes from the emergence of cloud computing to the digital transformation that are reshaping the 21 vertical industries based on our Software Taxonomy.
A Decade of Radical Transformation
In 2006, the enterprise applications market was pegged at $69.5 billion in license, maintenance and subscription revenues. By the end of 2015, it had reached $193 billion, or at a compound annual growth rate(CAGR) of 12% every year for the past decade.
During this period, the positioning of the top three vendors has remained unchanged, as shown in the following exhibit.
Exhibit 5 – Top Three Enterprise Applications Vendors and Their Market Shares in 2006 and 2015

Exhibit 6 shows the revenues of the Top 3 Enterprise Applications Vendors in 2006 and 2015.
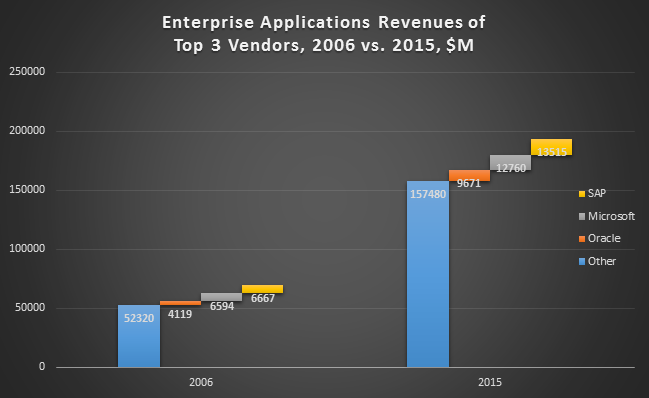
Despite the sharp jump in the size of the enterprise applications market, the collective shares held by SAP, Microsoft and Oracle have tumbled from 25% in 2006 to 18.5% in 2015, suggesting that the top three vendors have been losing ground to others during the 10-year period. By contrast, other vendors such as Salesforce and Cornerstone OnDemand have outpaced the market by a wide margin with the former bagging a 2.7% share of the market in 2015(up from 0.5% in 2006) and a CAGR of more than 35% through the decade, while the latter chalked up even better results.
Cornerstone OnDemand was ranked at No. 499 in 2006 with $4 million in product revenues. Last year, the HCM applications vendor zoomed to No. 92 with $272 million in Cloud applications subscription sales, resulting in a CAGR of nearly 60%.
Many enterprise applications vendors are not likely to post double-digit growth rates over the next few years based on our annual survey of more than 100,000 enterprise applications customers and their upgrade and replacement preferences.
Our forecast assumptions suggest that the enterprise applications market could see tepid growth and even plateau as it coalesces around a number of macro and secular factors including increased debt load of a growing number of enterprise applications vendors that could crimp their growth, a possible end of the cheap money era that could tighten the purse strings of institutional investors from venture capitalists to private equity firms, as well as a shifting competitive landscape in favor of certain industrial players that could make it harder for best-of-breed apps vendors to thrive. You can read our market forecast here.
Another striking development in the enterprise applications market through the past decade is that brutal competition has resulted in the disappearance of four out of every 10 companies. Among the 500 top enterprise applications vendors in 2006, 44%, or 219 entities, have exited the market succumbing to business failures and merger and acquisitions. On average, at least 20 major enterprise applications vendors have vanished each year over the past 10 years.

Through the decade, major enterprise applications vendors such as BusinessObjects, Cognos, Hyperion, Micros, Online Resources Corp. have all been gobbled up by their larger competitors, continuing the consolidation wave that wracked havoc when Oracle launched its hostile bid to acquire PeopleSoft in late 2004. Since that time, more vendors have changed hands or gone out of business after institutional investors – led by huge private equity firms like KKR, Silver Lake and Vista Equity Partners have each cobbled together an extensive portfolio of enterprise applications vendors and flipping it every few years for returns that range from stupendous to disastrous.
Volatility Clouds Apps Market
The sobering outcome was crystalized by the fire sale of Attensity, a social analytics applications vendor, to CRM apps vendor inContact for $6.6 million in February 2016, while the Attensity division in Europe was spun off to become Sematell. The breakup of Attensity came less than two years after it made a big splash by raising $90 million in financing in May 2014. All told, some shareholders of Attensity were left with a return of less than 10 cents for every dollar they put in.
Valuation of some Cloud apps vendors has dropped considerably. In April 2016, Teradata sold its Cloud-based marketing automation applications unit, formerly known as Aprimo, to Marlin Equity Partners for $90 million. The price Teradata fetched was much lower than the $525 million that it paid for Aprimo in early 2011.
The recent turmoil at health-benefits and HR apps vendor Zenefits, one of the so-called unicorns for its billion-dollar-plus valuation, is another example of the volatility that has engulfed the enterprise applications market. In February 2016, Zenefits, which has raised $580 million in financing, fired its founder Parker Conrad along with 250 employees, or 17% of its workforce, in order to refocus its energy on the small business market. Despite its rich allure, the enterprise applications market is going through an adjustment phase that could be long overdue for some, but unforgiving for others.
One of the reasons behind the big pivot(a catch-all phrase that brands every single move of a tech company these days) is that the popular way to sell enterprise applications via the Cloud is expensive because the vendors are basically taking on the intricate but resource-intensive work from hosting the apps to keeping the systems running smoothly 24×7, onerous tasks that used to be done by their customers. Today, vendors get paid less in the form of subscription fees compared with big upfront license deals in the past and in order to sell their products quickly and broadly by going global, their sales and marketing expenses could eat up half or more of their revenues, as in the cases of Salesforce and Box. If one’s idea of differentiation rests with a consolidation play model, the increased debt load – thanks to the era of cheap money – can only be dealt with by taking draconian measures.
For example, call-center applications vendor Aspect Software filed for Chapter 11 in March 2016 having experienced heightened competition from Cloud vendors as well as declining license revenues. The 43-year-old Aspect cited the bankruptcy filing as necessary and perhaps its last resort to reduce its considerable debt load. The filing was approved by its lenders erasing $320 million of debt off its books and giving Aspect some breathing room to recover. After reaching a high of nearly $600 million in revenues in 2006, its sales have been slipping gradually due to the rise of Cloud-based call center apps such as Five 9 and others. Last year Aspect posted about $400 million in revenues, despite its attempts to jumpstart its Cloud sales by acquiring Voxeo for $150 million in 2013.
In addition to slashing its debt load, Aspect is deploying other survival tactics including replacing legacy products that have been used by call centers of many consumer-facing brands. During the first quarter of 2016, both Aspect and its rival Genesys launched aggressive competitive replacement programs targeting those legacy systems from vendors like Avaya, Nice Systems and Verint.
When Going Gets Tough, The Tough Get Going
When the going gets tough, the tough get going pretty much sums up the state of the enterprise applications market.
Such are the cases of Oracle belittling the size of Cloud ERP installed base of its rival Workday in ad campaigns, the hard-charging Salesforce hiking software prices in February 2016 by up to 20%(first time in 14 years) at the risk of alienating some customers in order to accelerate growth and become the first $10-billion Cloud applications vendor, or IBM spending heavily in acquisitions in early 2016 in order to revive its applications revenues after a series of declines in recent quarters.
Companies that used to have little exposure to enterprise applications are gearing up to incorporate software product into their core offerings as part of their own digital transformation. Examples include media giant Cox paying $4 billion for Dealertrack’s auto-dealer apps, printer maker Lexmark buying Kofax for its document management apps for $1 billion, and industrial company Roper Technologies spending $675 million for Aderant apps for law firms. The biggest transformation of all goes to Dell with its pending purchase of EMC, the largest tech deal in history with a $67-billion price tag that covers a range of enterprise applications from Documentum for content management to Pivotal for analytics, not to mention VMware for cloud infrastructure and RSA for security.
Not to be outdone, Microsoft announced plans in June 2016 to acquire LinkedIn for a whopping $26.2 billion, enabling the PC computing giant to shore up its offerings in recruiting, eLearning and CRM applications, along with the opportunity to expose Microsoft’s Office 365 and other products in front of the social network’s 433 million members.
It’s no wonder that among this year’s Apps Top 500 vendors, at least 30% were involved in at least one major acquisition in 2015 – meaning that such transactions could have profound effects on one’s business for years to come. All these deals have not been consummated out of an act of desperation, but rather a watershed moment that could define eventual successes and ultimate failures of many enterprise applications vendors as the future of the business world calls for a radically different construct.
Big Moves By Top 25 Vendors
There were no shortages of big moves among the top 25 enterprise applications vendors in 2015 as shown in the following exhibit:
Exhibit 8 – Top 25 Enterprise Applications Vendors, Key Markets, 2014-2015 Enterprise Applications Revenues, 2015 Market Shares and Recent Developments
| Rank | Vendor Name | Key Market | 2015 Enterprise Applications Revenues, $M | 2014 Enterprise Applications Revenues, $M | 2014-2015 Change, % | 2015 Enterprise Apps Market Shares, % | Recent Developments |
|---|---|---|---|---|---|---|---|
| 1 | SAP | ERP | 13515 | 10950 | 23.4% | 7.0% | Cloud subscription revenues soared after acquiring Concur. |
| 2 | Microsoft | Content Management | 12760 | 13374 | -4.6% | 6.6% | Office 365 could eclipse desktop distribution. |
| 3 | Oracle | ERP | 9671 | 9430 | 2.6% | 5.0% | Banks on Cloud CRM, ERP and HCM apps to offset eroding license revenues. |
| 4 | Salesforce | CRM | 5198 | 4226 | 23.0% | 2.7% | Refocusing on Sales Cloud in FY17 with first price hike in 14 years. |
| 5 | IBM | Analytics | 4408 | 4598 | -4.1% | 2.3% | Acquisition strategy may shift in response to Cloud focus, management changes. |
| 6 | Adobe | Content Management | 4294 | 3697 | 16.1% | 2.2% | Subscription revenues dominate digital agenda. |
| 7 | FIS Global | Banking Apps | 3711 | 3797 | -2.3% | 1.9% | Acquired SunGard Data Systems for its financial apps for banks in 2015. |
| 8 | Dassault Systemes | PLM | 2792 | 2286 | 22.1% | 1.4% | Acquired Full Ownership of 3DPLM joint-venture partner in India in 2016. |
| 9 | Fiserv | Banking Apps | 2627 | 2533 | 3.7% | 1.4% | Core banking, eCommerce sales remain its key focus. |
| 10 | Autodesk | Engineering | 2357 | 2364 | -0.3% | 1.2% | Engineering and PLM offerings in transition to a subscription model and the Cloud. |
| 11 | HCM, Marketing | 2351 | 1783 | 31.9% | 1.2% | Talent and marketing solutions ride on user-generated content, fueling Cloud sales into staffing firms. | |
| 12 | Intuit | Accounting Apps | 2244 | 2187 | 2.6% | 1.2% | Successfully converted QuickBooks customers to subscription-only model. |
| 13 | Sage | Accounting Apps | 2100 | 2031 | 3.4% | 1.1% | Aligned with Salesforce for next-gen Cloud applications for SMBs. |
| 14 | Synopsys | Engineering | 2059 | 1909 | 7.9% | 1.1% | Synopsys remains entrenched in EDA market for integrated circuit design software for chip makers. |
| 15 | Infor | ERP | 2022 | 2023 | 0.0% | 1.0% | Acquired GTNexus for eMarketplace apps in 2015. |
| 16 | Cerner | Healthcare Apps | 1926 | 1398 | 37.8% | 1.0% | Acquired Siemens Medical for clinical apps in 2015. |
| 17 | Siemens PLM | PLM | 1799 | 1713 | 5.0% | 0.9% | Acquired CD-adapco for engineering simulation apps in 2016. |
| 18 | Open Text | Content Management | 1500 | 1400 | 7.1% | 0.8% | Acquired Daegis for information archiving, governance tools in 2015. |
| 19 | McKesson | Healthcare Apps | 1494 | 1453 | 2.8% | 0.8% | Incumbent status with support of its $176B drug distribution operations. |
| 20 | Ericsson | Billing, OSS/BSS | 1407 | 1200 | 17.3% | 0.7% | Consolidated gains in OSS and BSS apps, while steering telcos to 5G. |
| 21 | Constellation Software | ERP | 1301 | 1134 | 14.7% | 0.7% | Low-cost operating model buttresses its acquisition strategy now zeroing on healthcare vertical. |
| 22 | SAS Institute | Analytics | 1236 | 1190 | 3.9% | 0.6% | Posted $3.2B in total revenues in 2015 by focusing on Cloud, IoT and mobility. |
| 23 | NCR | Banking Apps | 1187 | 1157 | 2.6% | 0.6% | Acquired CimpleBox for SaaS-based back-office software to restaurant operators and retailers in 2016. |
| 24 | PTC | PLM | 1030 | 1078 | -4.5% | 0.5% | Acquired Kepware for its IoT communications platform in 2016. |
| 25 | Nuance Comm. | Healthcare, CRM Apps | 1011 | 1013 | -0.2% | 0.5% | Cloud applications strategy is a work in progress. |
| Subtotal | 86000 | 79924 | 7.6% | 44.5% | |||
| Other | 107426 | 107055 | 0.3% | 55.5% | |||
| Total | 193426 | 186979 | 3.4% | 100.0% |
Source: Apps Run The World, May 2016
SAP, the No. 1 enterprise applications vendor with $13.5 billion in product revenues in 2015, doubled down on its own Cloud transformation. After completing the $8.3-billion purchase of Cloud-based travel and expense management applications vendor Concur in December 2014, SAP approved a plan by Concur management team led by Steve Singh to grow further by hiring 1,000 more employees in 2015. With 6,000 employees already, Singh said Concur is on track to expand more by adding another 1,000 employees in 2016.
Among the leading enterprise applications vendors, few have been dealt the harsh blow of technology disruptions as Microsoft, the No. 2 enterprise applications vendor. First it was the ascent of Apple, which pulled the rug from under Microsoft as widespread use of smartphones started to render PC into a second fiddle eroding the Windows franchise along the way. Then the Cloud migration began to accelerate over the past few years, threatening the dominance of Office productivity applications, a perennial money-maker for Microsoft. Office and its Productivity and Business Processes products, which raked in as much as $22 billion in product revenues in fiscal 2014, are expected to continue to level off with decreasing pre-installed units through its OEM partners, while subscription revenues of its Office 365 counterpart gradually rising to offset some of the losses.
Faced with such twin forces that have halted Windows’ growth since 2010, Microsoft has been ramping up its Azure as the Cloud platform delivering in real time Office 365, Dynamics CRM around the world along with a host of other enterprise applications from its partners such as Tyler Technologies for public sector customers. The pending purchase of LinkedIn will help sustain the growth of Office 365, while giving Microsoft a much bigger Cloud platform to expand its enterprise footprint especially in greenfield markets such as online learning and the staffing industry.
Meanwhile, Oracle, the No. 3 enterprise applications vendor that is going through major transformation from a traditionally onpremise player to Cloud delivery, acquired AddThis in January 2016 for personalization applications, following its purchase of Maxymiser for marketing automation apps in August 2015 and Micros for retail applications in June 2014. Its CEO Safra Catz has repeatedly touted the Cloud adoption trend as the biggest money-making opportunity for Oracle since the company was found in 1977. Despite a sharp decline in onpremise license sales over the past year, Catz said Oracle is well positioned because of its large base of installed customers that will embrace its full portfolio of Cloud products as well as its $5-billion-plus investment in R&D every year to deliver seamless Cloud experiences for all customers.
While onpremise applications vendors are aiming to stem the tide with their hybrid Cloud capabilities(meaning they can support onpremise, hosting and Cloud-only implementations to accommodate any customer preference that comes their way), their rivals – especially those that have gone 100% Cloud – are forging ahead without any abandon.
Salesforce, the No. 4 enterprise applications vendor, acquired one of its partners Steelbrick for applications that boost configuration, pricing and quoting capabilities in December 2015, raising concerns among its other CPQ partners such as Apttus, which has since cozied up with Microsoft by supporting its Dynamics CRM applications. In June 2016, Salesforce made its biggest acquisition to date by paying $2.8 billion for Demandware for its retail and eCommerce applications. Never ceding any ground to its rivals, Salesforce has been focusing on boosting average deal size(its recent price hikes should help), pushing more into the upmarket with nine-figure deals with big insurers like Farmers and State Farm, as well as reigniting growth of its flagship product Sales Cloud applications for sales force automation.
Similar to Oracle, IBM, the No. 5 enterprise applications vendor, saw a drop in its enterprise applications revenues as it gradually replaced its lineup of products from Cognos to Websphere with newer Cloud releases. Additionally, IBM has spent nearly $4 billion since October 2015 to shore up its applications portfolio with purchases of Truven Health Analytics, a 2,500-person company previously owned by PE firm Veritas Capital, and Merge Healthcare for a range of clinical and imaging solutions. More changes are afoot with the departure of long-time executive Steve Mills, the former head of IBM Software unit who retired in December 2015.
Beyond The Top Five
For the remaining top 20 enterprise applications vendors, the move to the Cloud, perhaps by taking the interim step of adopting a subscription model to ensure a more predictable recurring revenue stream than traditional license sales, is largely a work in progress. Among these vendors, only LinkedIn sells its applications via the Cloud and nothing else, as the above exhibit demonstrates.
What these vendors have in common is that the majority of them continue to derive the bulk of their revenues from a handful of verticals as in the cases of FIS Global, Fiserv and NCR in banking and financial services, Cerner and McKesson in healthcare, and Ericsson in communications.
By focusing on these strategic verticals, vendors are likely to have greater control of the system replacement cycle because of the domain expertise that comes with their software and implementation methodology that raises switching costs as well as the barriers to entry for potential rivals.
The question is how sustainable is their vertical dominance at a time when customers are eager to look for viable options that could deliver better results at a lower price point even in industries that are considered slow-moving. The 12x jump in total revenues of athenahealth from $76 million in 2006 to $925 million in 2015 by selling electronic health record applications to healthcare providers underscores the fact that verticals are by no means averse to change.
That’s why ESW Capital, a private equity firm that acts as an enterprise applications consolidator across different verticals, is stepping up with a series of acquisitions including Aurea for retail, insurance and energy, Agentek for fuel transportation companies and electronic security providers, and Corizon for correctional health.
Other examples include Toronto-based Constellation Software whose successes in dozens of verticals through rapid-fire purchases of small to midsized enterprise applications vendors and revamping them with a lean operating model has been well covered in this piece.
The Pendulum Theory
After capturing a double-digit CAGR over the past decade, the enterprise applications market is expected to slow considerably – similar to the stalling of the pendulum at midpoint with little or no movement over the next five years, as shown in the following exhibit.

What’s to come could be another swing to the upside because of the convergence of these forces: mobility(about two billion mobile phones being shipped every year), Internet of Things(with industrial heavyweights like GE, Honeywell, Johnson Controls, Schneider Electric and Siemens all vying to preinstall smart apps into factories, office buildings, as well as maintenance procedures), and the acceleration of the replacement cycle of legacy systems because of the organizational needs to migrate to the Cloud, access real-time reporting with use of Big Data and be responsive to the changing data consumption , collaboration and decision-support patterns among a new generation of information workers most of whom were born in the 80s and 90s with no attachment to the personal computer revolution that preceded them.
The velocity of the a new round of system replacement is going to be significant as the majority of the 100,000 customers in our Buyer Insight Database continue to rely on outdated enterprise applications, many of which have not been upgraded or replaced since the Year 2000 conversion.
Public safety applications vendor Spillman Technologies reinforces the user behavior by pointing out that nearly 45 percent of its customers – covering more than 1,600 government agencies and 70,000 users – have used its software for at least 10 years. Almost 30 percent of Spillman’s customers have used its products for more than 15 years at the dawn of the new millennium.
By any measure, the past decade has been a rewarding period for many of the top 500 enterprise applications vendors.
Oracle’s market cap more than doubled during the period, while its applications customer count almost tripled to over 95,000 from 35,000 in 2006. Fusion Applications, which got off to a shaky start in 2006, are now a major underpinning of its Cloud strategy with more than 3,000 customers in the Cloud as of December 2015.
With little presence in the Cloud in 2006, SAP turbocharged its Cloud product portfolio after buying Ariba, Concur, and SuccessFactors. Cloud subscription revenues rose sharply during the period, representing more than one-third of its growth in 2015.
Even IBM may have found its mojo back with recent acquisitions in the healthcare space to buttress its Watson-led cognitive computing strategy after years of restructuring by divesting noncore operations such as offloading the PLM reselling business back to Dassault and the point-of-sale retail unit to Toshiba. In addition to analytics and cloud computing, IBM is setting sights on new areas of growth by developing an array of mobile applications for the enterprise with the help of Apple.
Because of the maturation of the technology curve, many enterprise applications vendors are not likely to survive the impending market shakeout and trials and tribulations of companies like Attensity and Zenefits will only serve as the footnote to the overall health of a market that remains highly attractive to all the key stakeholders involved.
Consider Collaboration software vendor Atlassian, which raised $462 million at a market cap of over $4 billion in December 2015 marking one of the few successful IPOs last year, or Toronto-based Intelex, which received $122 million in funding in August 2015 from investor group led by JMI Equity to further enhance its environmental, health and safety, and quality management applications offerings.
Amid the uncertainty, the only sure thing in the enterprise applications marketplace is that there will be hundreds or even thousands of other vendors waiting in the wings to take over the spot left vacated by any one of the Apps Top 500 vendors in 2016 and beyond.
More Enterprise Applications Research Findings
Based on the latest annual survey of 3,000+ enterprise software vendors, Apps Run The World is scheduled to be releasing a number of dedicated reports, which profile the world’s 500 largest Enterprise Applications Vendors(Apps Top 500) and the world’s 500 largest Cloud Applications Vendors(Cloud Top 500) ranked by their 2014-2015 product revenues. Their 2015 results are being broken down, sorted and ranked across 16 functional areas(from Analytics to Treasury and Risk Management) and by 21 vertical industries(from Aerospace to Utility), as shown in our Taxonomy. Further breakdowns by subvertical, country, company size, etc. are available as custom data cuts per special request.
Research Methodology
Each year our global team of researchers conduct an annual survey of thousands of enterprise software vendors by contacting them directly on their latest quarterly and annual revenues by country, functional area, and vertical market. We supplement their written responses with our own primary research to determine quarterly and yearly growth rates, In addition to customer wins to ascertain whether these are net new purchases or expansions of existing implementations.
Another dimension of our proactive research process is through continuous improvement of our customer database, which stores more than one million records on the enterprise software landscape of over 100,000 organizations around the world. The database provides customer insight and contextual information on what types of enterprise software systems and other relevant technologies are they running and their propensity to invest further with their current or new suppliers as part of their overall IT transformation projects to stay competitive, fend off threats from disruptive forces, or comply with internal mandates to improve overall enterprise efficiency.
The result is a combination of supply-side data and demand-generation customer insight that allows our clients to better position themselves in anticipation of the next wave that will reshape the enterprise software marketplace for years to come.
