
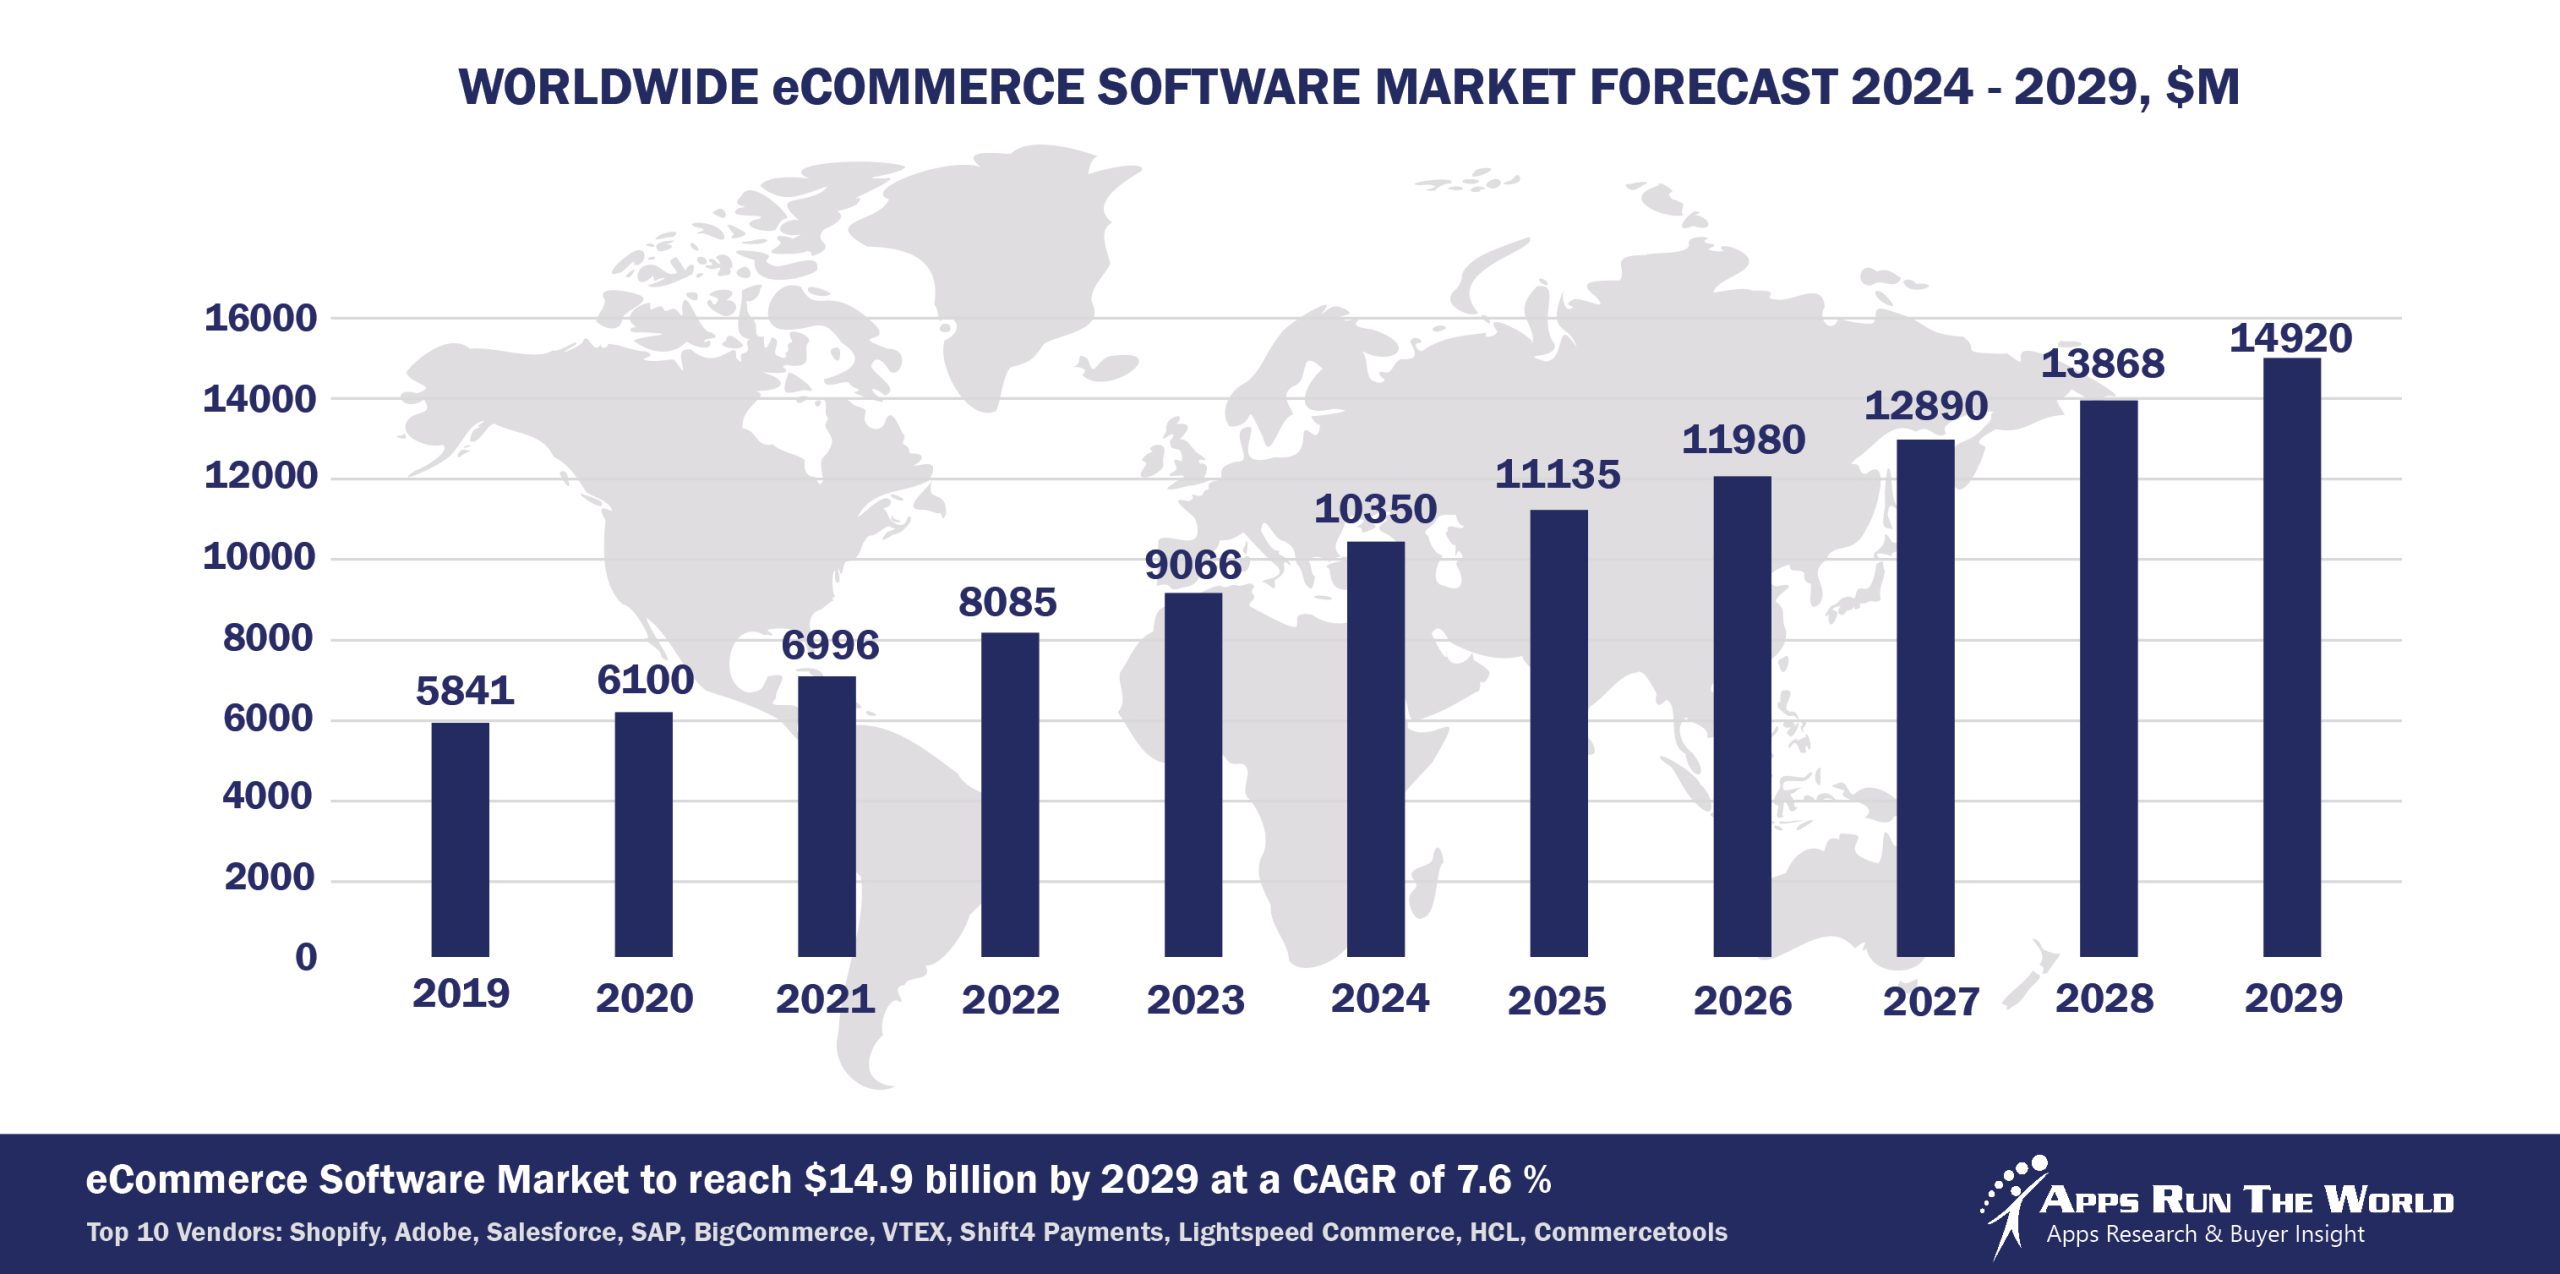
In 2024, the global eCommerce software market grew to $10.3 billion, marking a 14.2% year-over-year increase. The top 10 vendors accounted for 70.5% of the total market. Shopify led the pack with 22.7%, followed by Adobe, Salesforce, SAP, and BigCommerce.
Through our forecast period, the eCommerce applications market size is expected to reach $14.9 billion by 2029, compared with $10.4 billion in 2024 at a CAGR of 7.6%, as shown in the Apps Top 500 Report – Excel Edition [Preview] .
eCommerce applications include those designed for shopping cart automation, order management, inventory management, Web-based point of sale, multi-channel retailing, procurement, sourcing, and supplier relationship management.
Here are the rankings of the top 10 eCommerce software vendors in 2024 and their market shares.
Source: Apps Run The World, July 2025
Other eCommerce software providers included in the report are: ACI Worldwide, Inc., Amazon Web Services (AWS), Aptean, Aptos, ARI Network, Asseco Group, Automattic, Capillary Technologies, CDK Global, Cleverbridge, Constellation Software Inc., Cox Automotive, CSG Systems International, Deem, Digital River, Ekm Systems, Elastic Path, Optimizely (formerly Episerver), FastSpring, Fiserv, Inetum (ex GFI Informatique), Intershop, iptor, Jack Henry & Associates, Kentico Software, Kibo, Kingdee, Kooomo, Liferay, NCR Corporation, Odoo, Pronto Software, PROS Holdings, Reynolds and Reynolds, Sage, Travelport, Unilog, Volusion, WisageTech, and many others.
Vendor Snapshot: eCommerce Market Leaders
 Shopify
Shopify is positioning itself as a platform that balances merchant control with the adoption of agent-based AI. Its strategy involves upgrading core infrastructure so smart agents can manage tasks like segmentation, discounting, and inventory—but always within guardrails that prevent unchecked automation. Recent updates require human oversight for “buy-for-me” bots, with agent integration limited to official APIs and checkout SDKs. Shopify is also preparing for chat-based shopping through collaborations with large language model providers. By embedding AI expertise as a core performance measure, Shopify aligns product development and go-to-market strategy around agent-driven innovation while preserving ecosystem stability.
Adobe
Adobe is embedding agent orchestration into its e-commerce strategy through a multi-agent workflow management layer that governs personalization, content delivery, and conversational commerce journeys. Strategic partnerships with global systems integrators place these agentic components within composable, data-driven customer journeys tied to Adobe’s knowledge graph. Adobe Commerce (ex Magento) now supports real-time analytics agents that detect behavior trends and trigger automated personalization or content adaptation with minimal developer input. The roadmap empowers enterprise customers to configure AI-powered agents, enable conversational interfaces, and deliver end-to-end autonomous analytics pipelines that drive differentiated digital experiences at scale.
Salesforce
Salesforce Commerce Cloud (ex Demandware) has expanded integration with Salesforce CDP and Marketing Cloud to unify customer data, enable omnichannel marketing orchestration, and provide intelligent merchandising. Its commerce platform now includes AI-driven predictive recommendations, mobile-optimized checkout, and API-first modular storefront components. Investments in Developer APIs, Partner Ecosystem, and cross-cloud integration further Salesforce’s ambition to deliver seamless commerce experiences tightly connected to CRM and service capabilities.
SAP
SAP Commerce Cloud (ex Hybris) recently enhanced headless storefront flexibility, composable data services, and AI-assisted search and product recommendations. Deep integrations with SAP S/4 HANA and SAP Emarsys enable real-time pricing adjustments and personalized experience flows. SAP’s ongoing investments and partner expansions support modular deployments for both B2B and B2C retail environments, strengthening AI-powered commerce operations.
BigCommerce
BigCommerce has rebranded as “Commerce” and leverages its open SaaS foundation to expand agent-driven commerce modules. Merchants can deploy chat-based shopping agents embedded into storefronts and utilize agent-led dynamic pricing and campaign optimization. Its API-first architecture supports third-party agent builders plugging into order, inventory, and analytics events to create autonomous workflows with minimal developer effort. This composable platform serves as a flexible host environment for both native and partner-built autonomous commerce functions.
VTEX
VTEX advances its digital commerce strategy with agentic orchestration across marketplace and order management functions. Merchants deploy autonomous agents that continuously adjust promotions, restock thresholds, and buyer segmentation based on real-time data. VTEX’s go-to-market focuses on agent-enabled headless commerce, supported by no-code editors allowing business teams to script conversational bots and automated engagement flows. Capabilities extend to supplier negotiation, A/B experimentation, and checkout optimization, forming a unified orchestration layer for enterprise commerce.
Shift4
Shift4 embeds autonomous agents to enhance operational efficiency for SMB merchants. Updates include assistants monitoring marketing performance, optimizing couponing, suggesting product bundles, and managing retention. Its roadmap emphasizes low-code interfaces that let retailers configure agents interacting with payments, promotions, and fulfillment. Though less complex than larger enterprise offerings, Shift4 positions itself as a practical enabler of conversational commerce plugins and agentic automation for cost-sensitive merchants seeking lightweight AI-driven efficiencies.
Lightspeed Commerce
Lightspeed expands its commerce ecosystem with autonomous analytics agents tailored to retail and hospitality. These agents identify sales trends, trigger restocking, and recommend cross-sells via conversational dashboards. The platform prioritizes no-code agent configuration, giving store owners tools to set up bots that proactively manage promotions and inventory without developer resources. Strategic acquisitions of analytics startups reinforce Lightspeed’s push toward full-stack agentic offerings, differentiating itself in omni-channel commerce through accessible automation and intelligence.
HCL Technologies
HCL modernizes its enterprise commerce platform by embedding process-automation agents designed for B2B clients with complex transactional requirements. The roadmap includes agentic modules managing contract fulfillment, quote-to-cash processes, and customer engagement triggered by behavioral signals. Ecosystem partnerships enable low-code agent builders within its digital experience suite, allowing enterprises to deploy conversational ordering agents, back-office reconciliation bots, and autonomous analytics tools. HCL Commerce bridges legacy systems with next-generation agentic capabilities.
Commercetools
Commercetools is evolving its headless commerce architecture into an agentic-first foundation, with autonomous agents orchestrating pricing, promotions, inventory, and customer interactions across microservices. The company’s roadmap promotes low-code frameworks that empower architects to design multi-agent pipelines carrying tasks from browsing through fulfillment autonomously. This approach positions Commercetools Commerce as a composable domain where enterprise teams can embed agentic intelligence directly into business logic. By aligning microservices flexibility with agent-based orchestration, Commercetools is building a differentiated path toward adaptive, intelligent digital commerce infrastructures.
ARTW Technographics Platform: eCommerce customer wins
Since 2010, our research team has been studying the patterns of the eCommerce software purchases, analyzing customer behavior and vendor performance through continuous win/loss analysis. Updated quarterly, the ARTW Technographics Platform provides deep insights into thousands of eCommerce customer wins and losses, helping users monitor competitive shifts, evaluate vendor momentum, and make informed go-to-market decisions.
List of eCommerce customers
Source: ARTW Buyer Insights Technographic Database
Custom data cuts related to the eCommerce Applications market are available:
- Top 100+ eCommerce Applications Vendors and Market Forecast 2024-2029
- 2024 eCommerce Applications Market By Industry (21 Verticals)
- 2024 eCommerce Applications Market By eCommerce Segments and Categories
- 2024 eCommerce Applications Market By Country (USA + 45 countries)
- 2024 eCommerce Applications Market By Region (Americas, EMEA, APAC)
- 2024 eCommerce Applications Market By Revenue Type (License, Services, Hardware, Support and Maintenance, Cloud)
- 2024 eCommerce Applications Market By Customer Size (revenue, employee count, asset)
- 2024 eCommerce Applications Market By Channel (Direct vs Indirect)
- 2024 eCommerce Applications Market By Product
Worldwide Enterprise Application Market
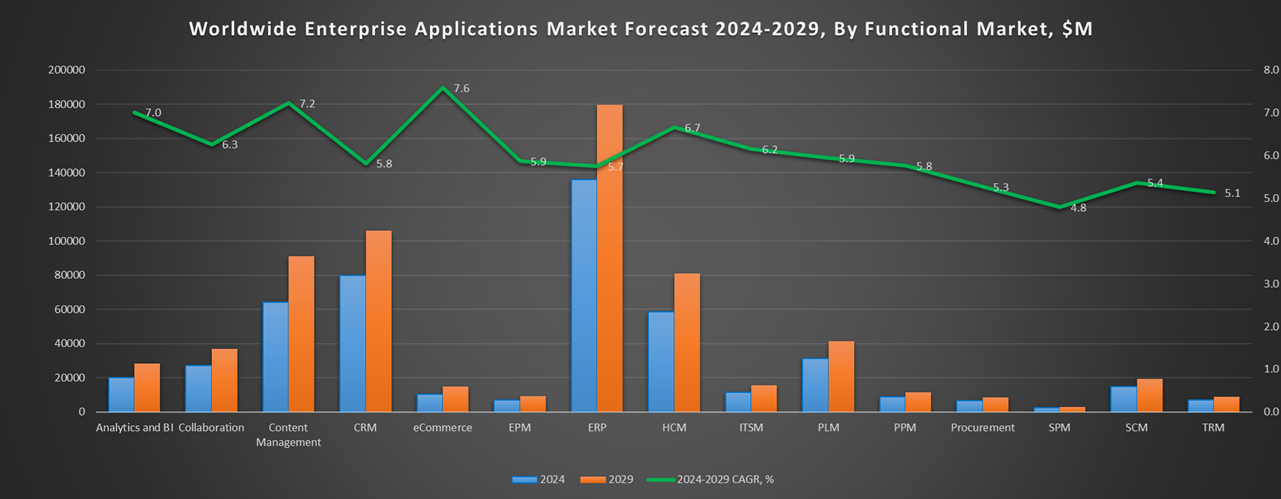
Exhibit 3 provides a forecast of the worldwide enterprise application market from 2024 to 2029, highlighting market sizes, year-over-year growth, and compound annual growth rates across various functional segments. The data shows strong growth in emerging areas like eCommerce, Human Capital Management, and IT Service Management, while traditional segments like ERP and CRM continue to dominate in market size.
Exhibit 3: Worldwide Enterprise Application Market Forecast 2024-2029 by Functional Market, $M
Source: Apps Run The World, July 2025
Exhibit 4 shows the enterprise applications market by functional area. The highest growth functional markets revolve around smaller segments like eCommerce, Enterprise Performance Management, Sales Performance Management and Treasury and Risk, where first movers remain less established than those that for decades have been entrenched in functional areas like ERP, CRM and PLM.
FAQ – APPS RUN THE WORLD Top 10 eCommerce Software Vendors, Market Size & Forecast
Q1. What is the global eCommerce software market size in 2024?
A: The global eCommerce software market was $10.3 billion in 2024, growing 14.2% year-over-year as enterprises accelerated digital commerce initiatives.
Q2. Who are the top 10 eCommerce software vendors in 2024 and what share do they hold?
A: The top 10 eCommerce software vendors are Shopify, Adobe, Salesforce, SAP, BigCommerce, VTEX, Shift4, Lightspeed, HCL, and Commercetools, together accounting for 70.5% of the total market.
Q3. Which vendor leads the eCommerce software market in 2024?
A: Shopify leads the eCommerce software market with approximately 22.7% market share in 2024.
Q4. What kinds of applications are included in the scope of eCommerce software in this report?
A: The report covers applications for shopping cart automation, order management, inventory management, web-based point of sale, multi-channel retailing, and procurement and supplier management.
Q5. What is the forecast for the eCommerce software market through 2029?
A: The eCommerce software market is expected to reach $14.9 billion by 2029, up from $10.3 billion in 2024, at a 7.6% CAGR.
Q6. Which other eCommerce vendors are covered beyond the top 10?
A: The report also covers vendors such as WooCommerce, Magento, Wix, Ecwid, PrestaShop, Square, and Oracle NetSuite.
Q7. When was this eCommerce report published and by whom?
A: The Top 10 eCommerce Software Vendors, Market Size & Forecast 2024–2029 report was published July 23, 2025 by APPS RUN THE WORLD, as part of the APPS TOP 500 research program, which benchmarks the revenues and market share of the world’s 1,500+ largest enterprise application vendors.
More Enterprise Applications Research Findings
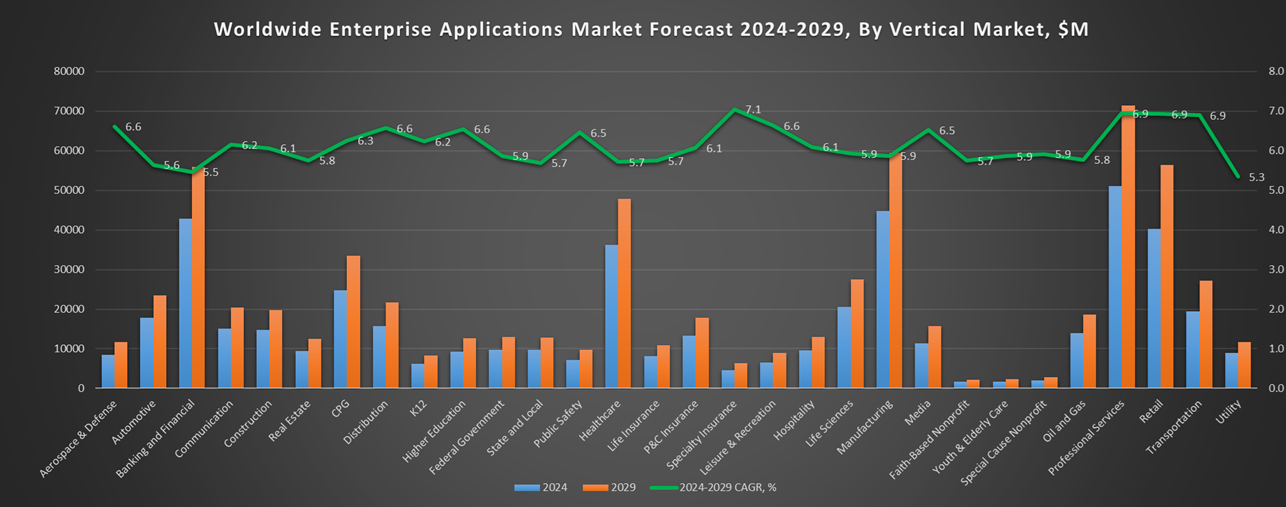
Based on the latest annual survey of 10,000+ enterprise software vendors, Apps Run The World is releasing a number of dedicated reports, which profile the world’s 1,500 largest Enterprise Applications Vendors ranked by their 2024 product revenues. Their 2024 results are being broken down, sorted and ranked across 16 functional areas (from Analytics and BI to Treasury and Risk Management) and by 21 vertical industries (from Aerospace to Utility), as shown in our Taxonomy. Further breakdowns by subvertical, country, company size, etc. are available as custom data cuts per special request.
Research Methodology
Each year our global team of researchers conduct an annual survey of thousands of enterprise software vendors by contacting them directly on their latest quarterly and annual revenues by country, functional area, and vertical market.
We supplement their written responses with our own primary research to determine quarterly and yearly growth rates, In addition to customer wins to ascertain whether these are net new purchases or expansions of existing implementations.
Another dimension of our proactive research process is through continuous improvement of our customer database, which stores more than one million records on the enterprise software landscape of over 2 million organizations around the world.
The database provides customer insight and contextual information on what types of enterprise software systems and other relevant technologies are they running and their propensity to invest further with their current or new suppliers as part of their overall IT transformation projects to stay competitive, fend off threats from disruptive forces, or comply with internal mandates to improve overall enterprise efficiency.
The result is a combination of supply-side data and demand-generation customer insight that allows our clients to better position themselves in anticipation of the next wave that will reshape the enterprise software marketplace for years to come.
- Ihs, a United States based Professional Services organization with 8600 Employees
- Graphics Arts Solution, a United States based Professional Services company with 50 Employees
- National Australia Bank, a Australia based Banking and Financial Services organization with 41880 Employees
| Logo | Company | Industry | Employees | Revenue | Country | Evaluated |
|---|
