
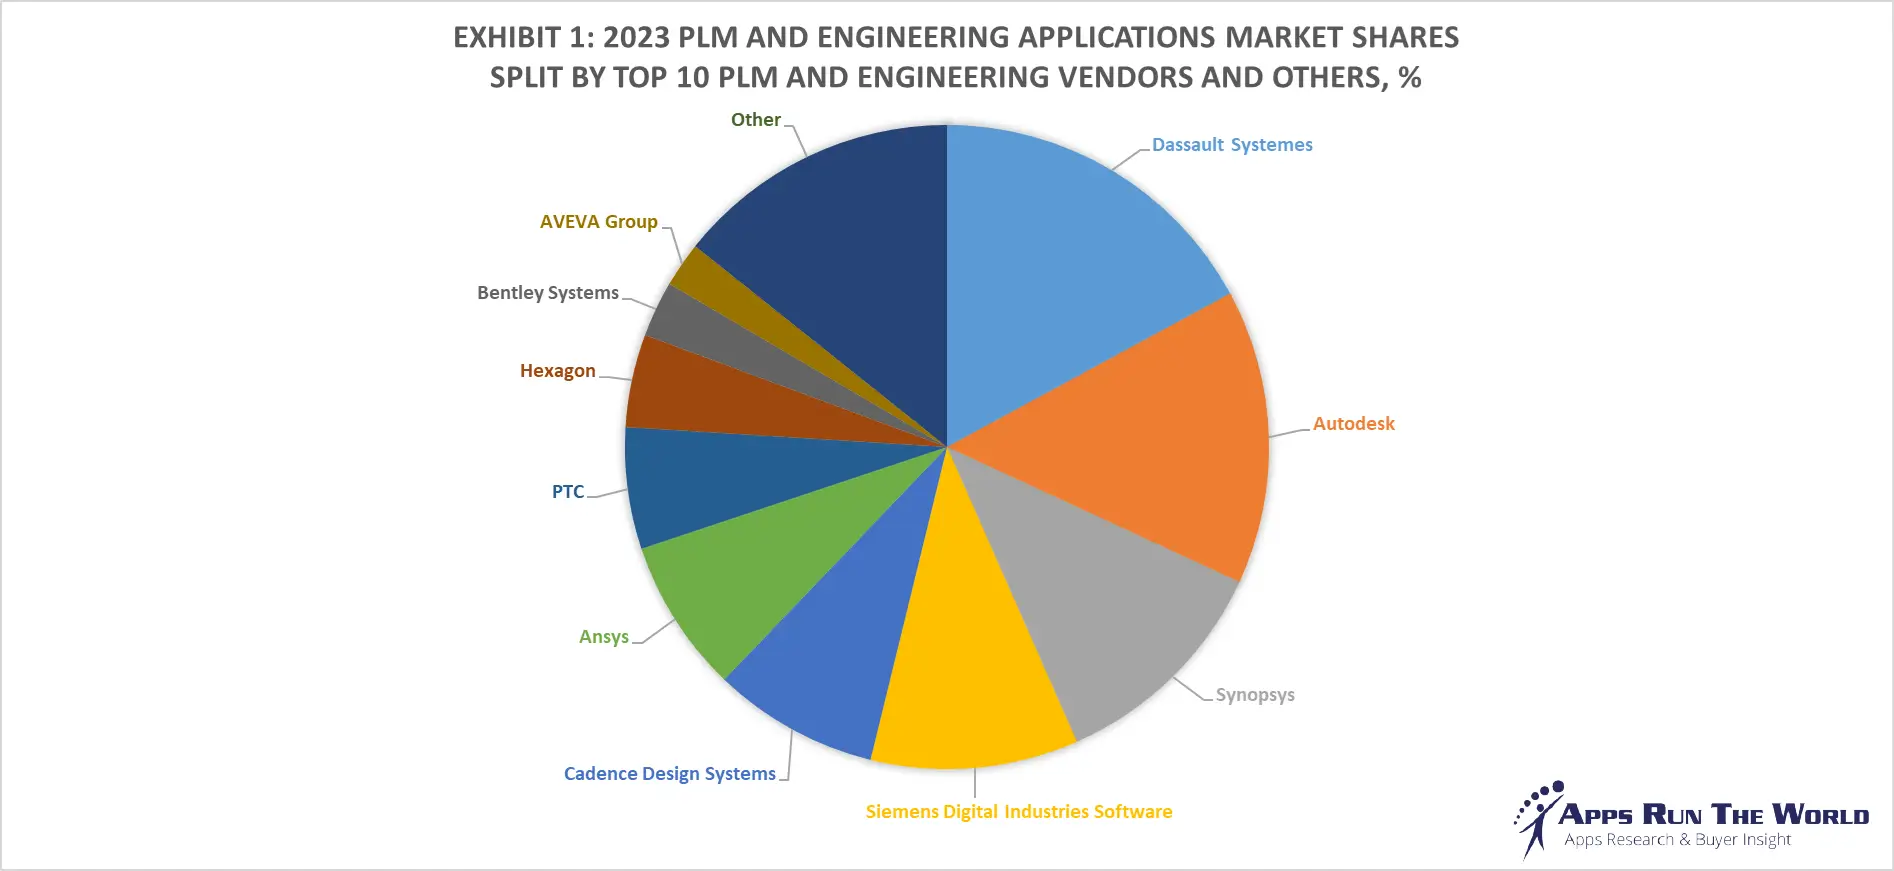
In 2023, the global Product LifeCycle Management and Engineering (PLM) software market surged to nearly $28.4 billion, growing by 9.6%. The top 10 vendors commanded a significant 85.7% market share, with Dassault Systemes leading at 17.1%, followed by Autodesk, Synopsys, Siemens Digital Industries Software, and Cadence Design Systems.
Our APPS TOP 500 Market Report (Preview) covers thousands of PLM software vendors, offering deep insights into market dynamics, vendor strengths, AI investments, customer momentum, and go-to-market strategies providing valuable perspectives on market trends and challenges.
Discover thousands of PLM Customer Wins with the ARTW Technographics Platform, an essential resource for technology enthusiasts, sales business leaders, and data-driven marketing executives, offering curated insights into the evolving landscape of the software industry, including the latest developments in PLM.
Through our forecast period, the PLM and Engineering applications market size is expected to reach $34.3 billion by 2028, compared with $28.4 billion in 2023 at a compound annual growth rate of 3.8%.
| Exhibit 2: Worldwide PLM and Engineering Software Market 2023-2028 Forecast, $M | |||
|---|---|---|---|
| Year | 2023 | 2028 | 2023-2028 CAGR, % |
| Total | 28401 | 34275 | 3.8% |
Source: Apps Run The World, June 2024
Top 10 PLM and Engineering Software Vendors
Product Lifecycle Management applications enable key stakeholders including designers, engineers and OEMs to gain and optimize visibility into the entire product life cycle from idea generation to collaboration and from product data management to iterative development efforts. PLM applications are considered a derivative market with revenue contribution to functional areas such as Project and Portfolio Management, Enterprise Resource Planning and Manufacturing.
Consolidation wave propels Dassault to new heights, while other incumbents are in search of new business models through subscription pricing.
Here are the rankings of the top 10 PLM and Engineering software vendors and their market shares in 2023.
| Rank | Vendor | 2021 PLM & Engineering Apps Revenues, $M | 2022 PLM & Engineering Apps Revenues, $M | 2023 PLM & Engineering Apps Revenues, $M | YoY Growth | 2023 PLM & Engineering Market Share, % |
|---|---|---|---|---|---|---|
| 1 | Dassault Systemes | Subscribe | Subscribe | Subscribe | 11.4% | Subscribe |
| 2 | Autodesk | Subscribe | Subscribe | Subscribe | 12.1% | Subscribe |
| 3 | Synopsys | Subscribe | Subscribe | Subscribe | 18.7% | Subscribe |
| 4 | Siemens Digital Industries Software | Subscribe | Subscribe | Subscribe | 5.7% | Subscribe |
| 5 | Cadence Design Systems | Subscribe | Subscribe | Subscribe | 16.2% | Subscribe |
| 6 | Ansys | Subscribe | Subscribe | Subscribe | 9.9% | Subscribe |
| 7 | PTC | Subscribe | Subscribe | Subscribe | 8.5% | Subscribe |
| 8 | Hexagon | Subscribe | Subscribe | Subscribe | 8.9% | Subscribe |
| 9 | Bentley Systems | Subscribe | Subscribe | Subscribe | 11.8% | Subscribe |
| 10 | AVEVA Group | Subscribe | Subscribe | Subscribe | 8.3% | Subscribe |
| Subtotal | Subscribe | Subscribe | Subscribe | 11.6% | Subscribe | |
| Other | Subscribe | Subscribe | Subscribe | -0.7% | Subscribe | |
| Total | 22750 | 25902 | 28401 | 9.6% | 100.0% |
Source: Apps Run The World, June 2024
Other PLM and Engineering software providers included in the report are abas, ABB, Adobe, Altair Engineering, Aptos, Aspen Technology, Centric Software, Corel Corporation, HCL Technologies Ltd., Honeywell International, IDBS, IFS, Ignite Technologies, Intelex Technologies, IQVIA, Johnson Controls, Kingdee, Landmark, Microsoft, Nemetschek Group, Oracle, PerkinElmer Informatics, Planon, RIB Software SE, Rockwell Automation, Roper Technologies, SAP, Schlumberger Software, Schrodinger, Sopheon, TopSolid, Trace One, Trimble, VertiGIS, and many others.
Custom data cuts related to the PLM and Engineering Applications market are available:
- Top 70+ PLM and Engineering Applications Vendors and Market Forecast 2023-2028
- 2023 PLM and Engineering Applications Market By Industry (21 Verticals)
- 2023 PLM and Engineering Applications Market By PLM and Engineering Segments and Categories
- 2023 PLM and Engineering Applications Market By Country (USA + 45 countries)
- 2023 PLM and Engineering Applications Market By Region (Americas, EMEA, APAC)
- 2023 PLM and Engineering Applications Market By Revenue Type (License, Services, Hardware, Support and Maintenance, Cloud)
- 2023 PLM Applications Market By Customer Size (revenue, employee count, asset)
- 2023 PLM and Engineering Applications Market By Channel (Direct vs Direct)
- 2023 PLM and Engineering Applications Market By Product
Buyer Intent: Companies Reading this Research ReportARTW Buyer Intent uncovers actionable customer signals, identifying software buyers actively reading this research report. Gain ongoing access to real-time prospects and uncover hidden opportunities. Companies Actively accessing this research report include:
- Lexar Partners, a Netherlands based Banking and Financial Services organization with 20 Employees
- INSTITUTE OF TECHNICAL EDUCATION, a Singapore based Education company with 2100 Employees
- Radio Television Hong Kong, a Hong Kong based Media organization with 300 Employees
Logo Company Industry Employees Revenue Country Evaluated Worldwide Enterprise Application Market
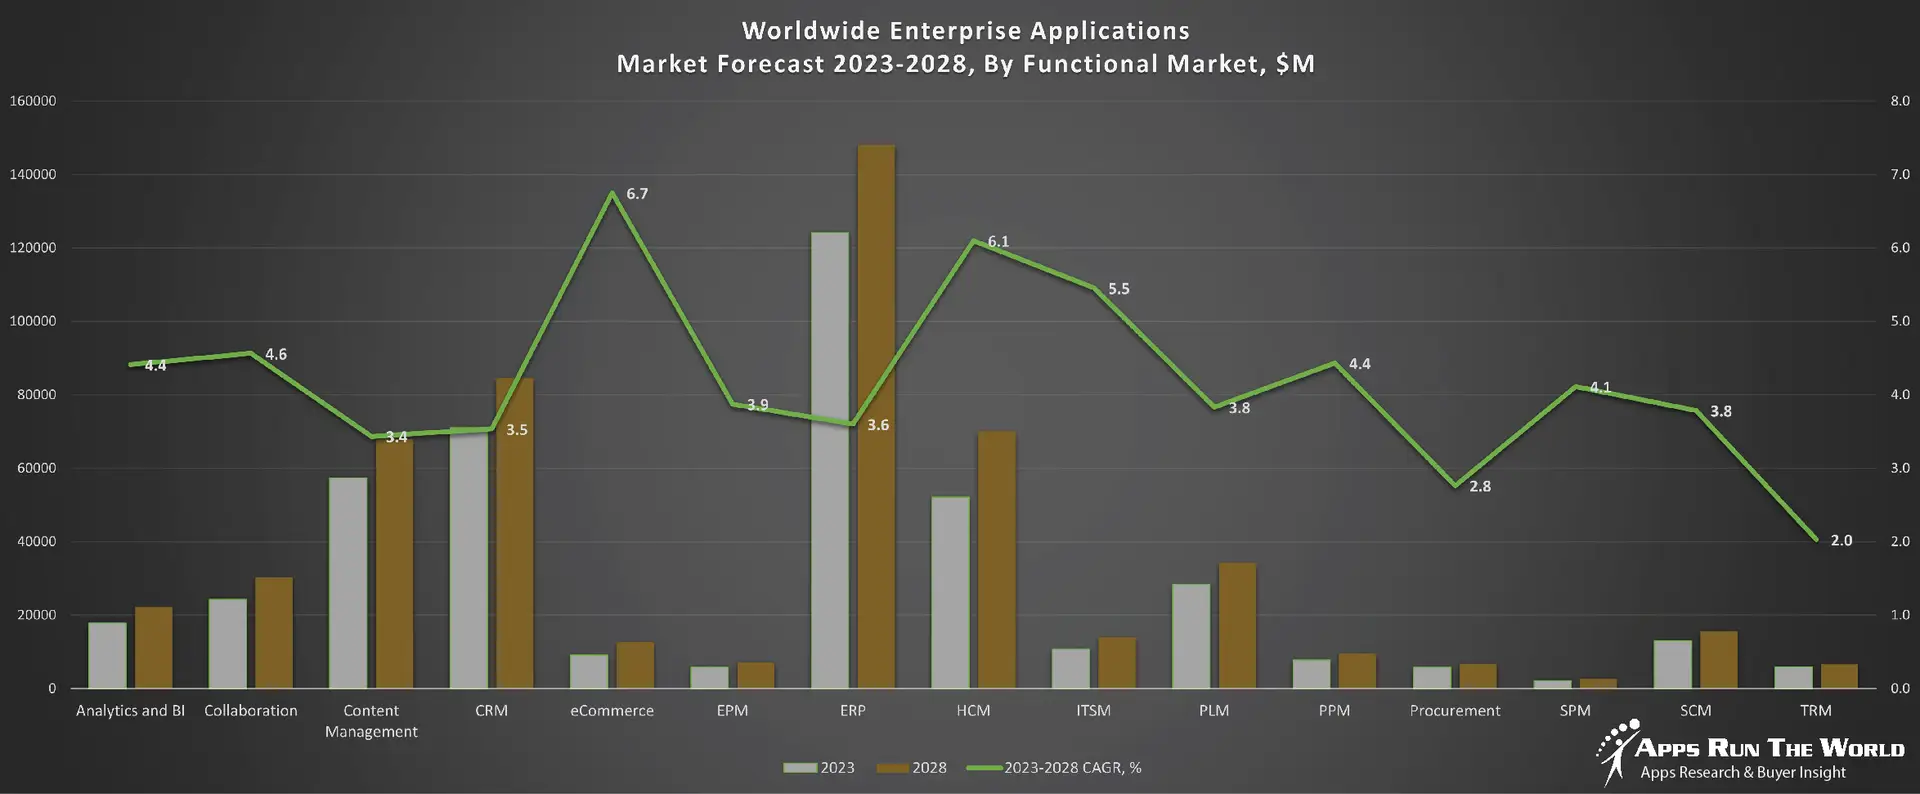
Exhibit 3 provides a forecast of the worldwide enterprise application market from 2023 to 2028, highlighting market sizes, year-over-year growth, and compound annual growth rates across various functional segments. The data shows strong growth in emerging areas like eCommerce, Human Capital Management, and IT Service Management, while traditional segments like ERP and CRM continue to dominate in market size.
Exhibit 3: Worldwide Enterprise Application Market Forecast 2023-2028 by Functional Market ($M)
Source: Apps Run The World, June 2024
Exhibit 4 shows the enterprise applications market by functional area. The highest growth functional markets revolve around smaller segments like eCommerce, Enterprise Performance Management, Sales Performance Management and Treasury and Risk, where first movers remain less established than those that for decades have been entrenched in functional areas like ERP, CRM and PLM.
PLM and Engineering Win/Loss Analysis As Part Of Enterprise Applications Buyer Insight Customer Database
On the buyer side, customers are investing in Product LifeCycle Management and Engineering systems based on new features and capabilities that are expected to replace their existing legacy systems. In many cases, competitive upgrades and replacements that could have a profound impact on future market-share changes will become more widespread.
Since 2010, our global team of researchers have been studying the patterns of the latest PLM software purchases by customers around the world, aggregating massive amounts of data points that form the basis of our forecast assumptions and perhaps the rise and fall of certain vendors and their products on a quarterly basis.
Updated continuously, our database features extensive win/loss analysis. Each year our research team identifies tens of thousands of these customer wins and losses from public and proprietary sources.
The research results are being incorporated into regular updates in our Enterprise Applications Buyer Insight Customer Database. You can access the Quarterly Win/Loss Analysis Scoreboard and our Enterprise Applications Buyer Insight Customer Database by becoming a subscriber.
Source: Apps Run The World, June 2024
More Enterprise Applications Research Findings
Based on the latest annual survey of 3,000+ enterprise software vendors, Apps Run The World is releasing a number of dedicated reports, which profile the world’s 500 largest Enterprise Applications Vendors (Apps Top 500) ranked by their 2019-2023 product revenues.
Their 2023 results are being broken down, sorted and ranked across 16 functional areas(from Analytics to Treasury and Risk Management) and by 21 vertical industries (from Aerospace to Utility), as shown in our Taxonomy. Further breakdowns by subvertical, country, company size, etc. are available as custom data cuts per special request.
Research Methodology
Each year our global team of researchers conduct an annual survey of thousands of enterprise software vendors by contacting them directly on their latest quarterly and annual revenues by country, functional area, and vertical market.
We supplement their written responses with our own primary research to determine quarterly and yearly growth rates, In addition to customer wins to ascertain whether these are net new purchases or expansions of existing implementations.
Another dimension of our proactive research process is through continuous improvement of our customer database, which stores more than one million records on the enterprise software landscape of over 100,000 organizations around the world.
The database provides customer insight and contextual information on what types of enterprise software systems and other relevant technologies are they running and their propensity to invest further with their current or new suppliers as part of their overall IT transformation projects to stay competitive, fend off threats from disruptive forces, or comply with internal mandates to improve overall enterprise efficiency.
The result is a combination of supply-side data and demand-generation customer insight that allows our clients to better position themselves in anticipation of the next wave that will reshape the enterprise software marketplace for years to come.
