
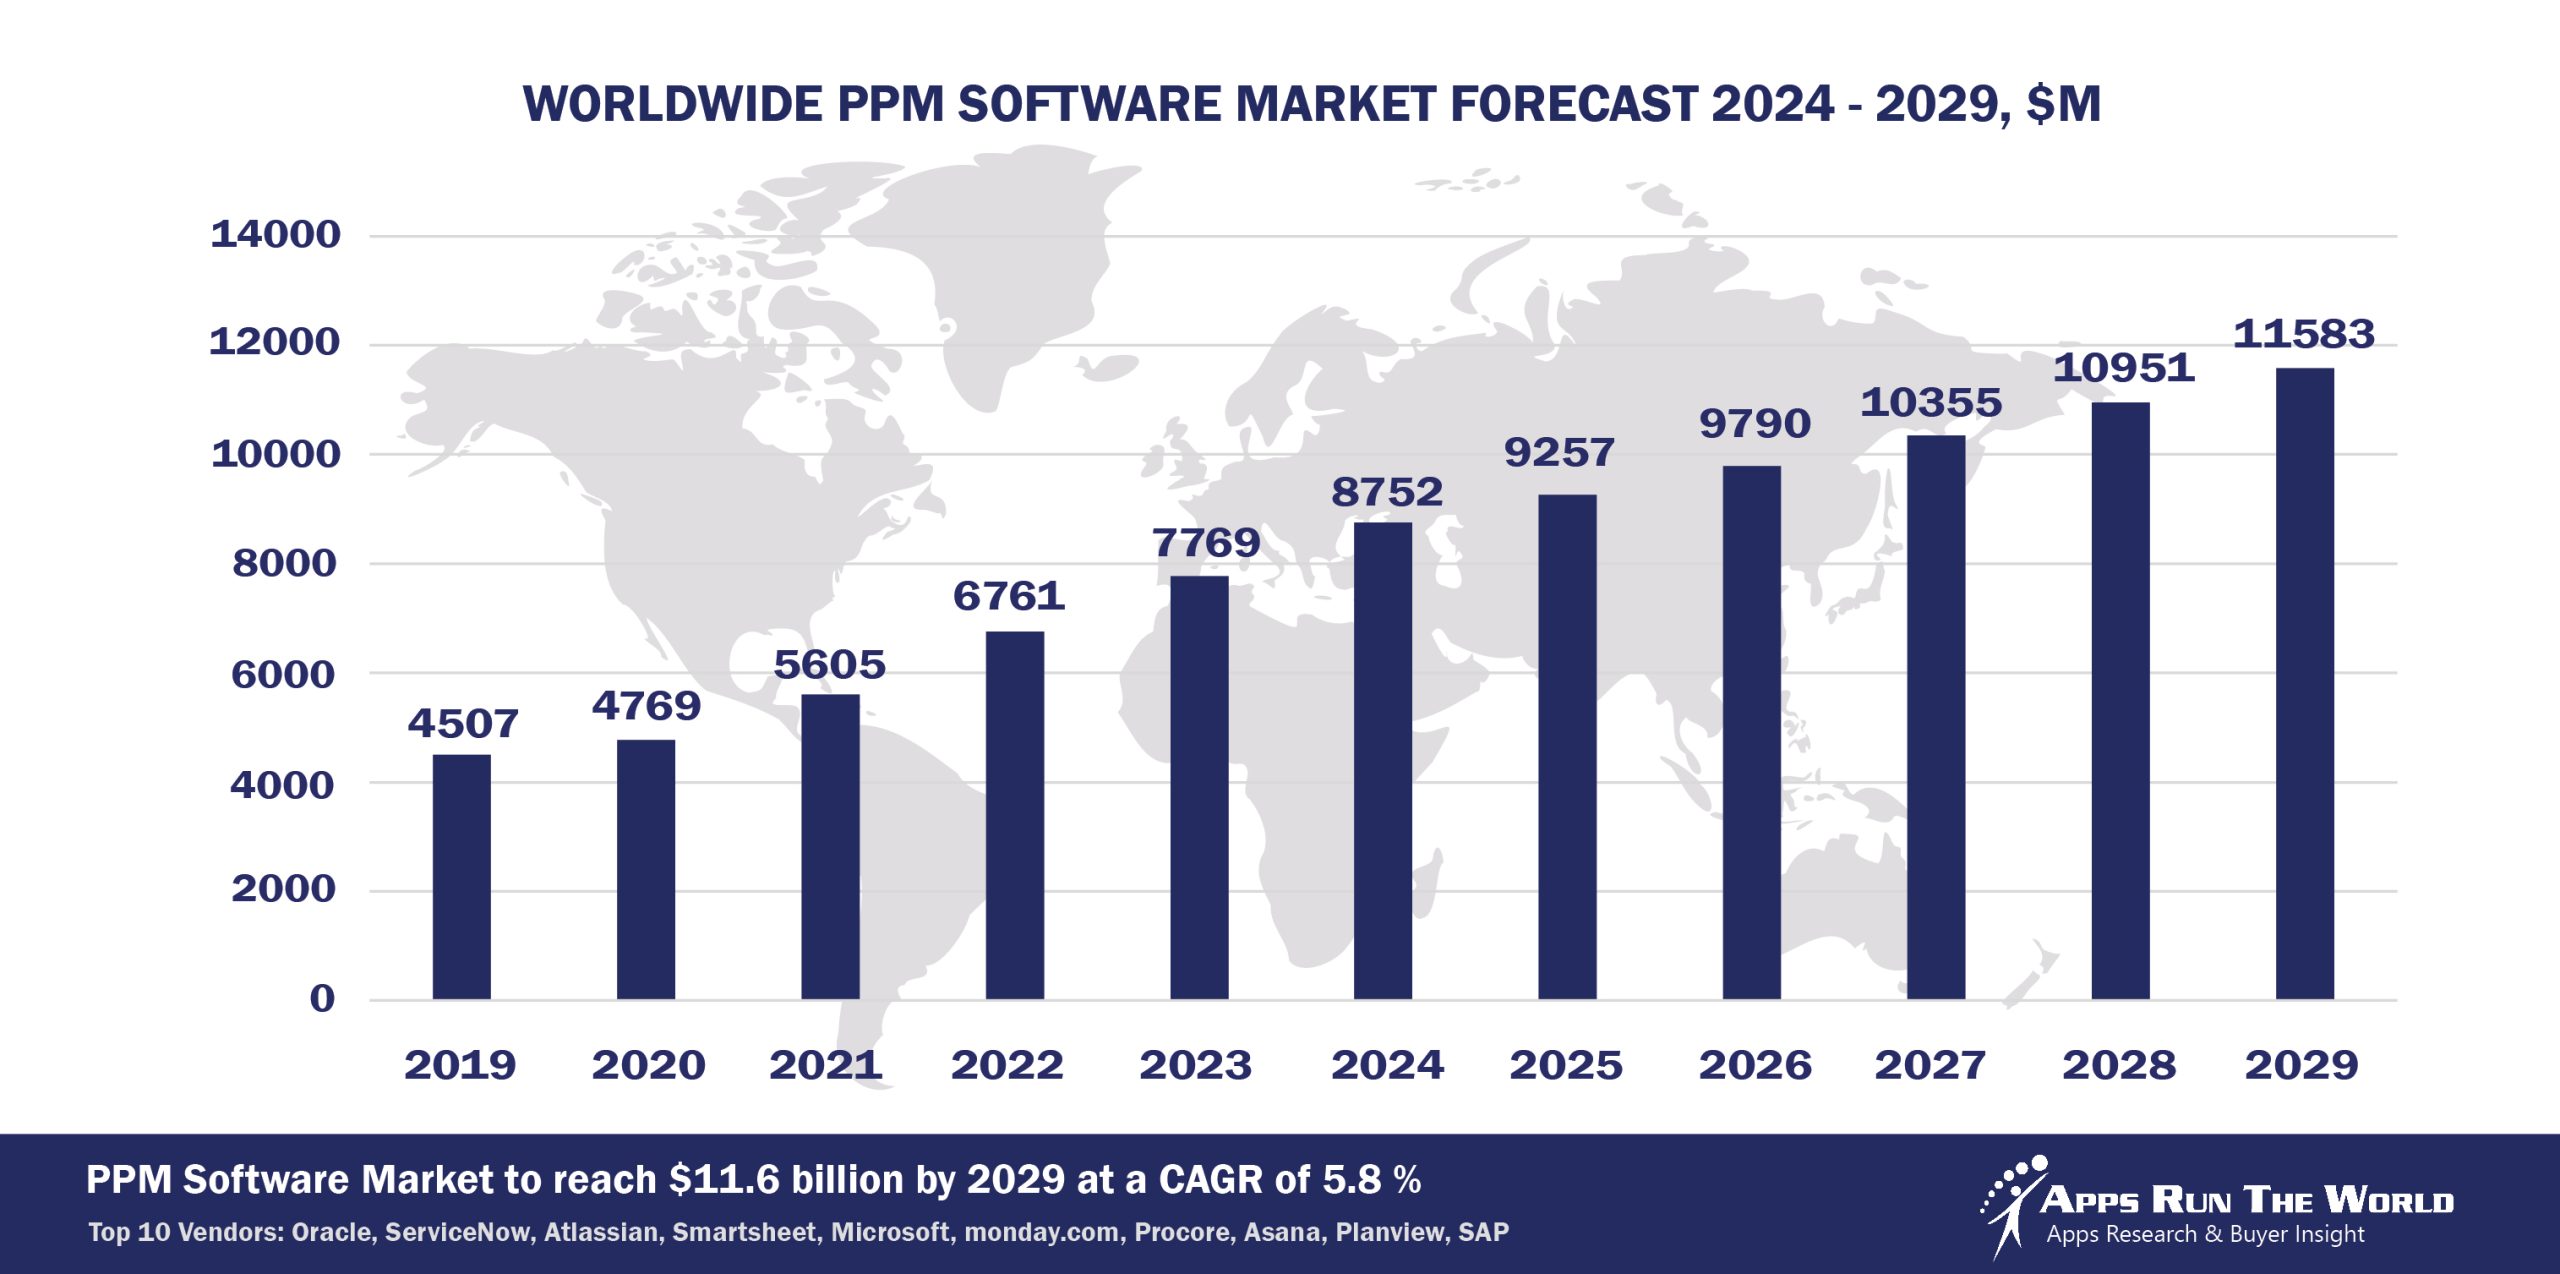
In 2024, the global Project Portfolio Management software market grew to $8.7 billion, marking a 12.7% year-over-year increase. The top 10 vendors accounted for 60.5% of the total market. Oracle led the pack with an 8.5% market share, followed by ServiceNow, Atlassian, Smartsheet, and Microsoft.
Through our forecast period, the Project Portfolio Management applications market size is expected to reach $11.6 billion by 2029, compared with $8.8 billion in 2024 at a CAGR of 5.8%, as shown in the Apps Top 500 Report – Excel Edition [Preview] .
Project and portfolio management (PPM) applications include those that automate and optimize the initiation, planning/scheduling, allocation, monitoring, and measuring of activities and resources required to complete projects. PPM applications also cover certain aspects of IT service management, especially those that involve project portfolio management within the IT domain.
Top 10 Project Portfolio Management Vendors in 2024 and their Market Shares
Source: Apps Run The World, July 2025
Other PPM software providers included in the report are: 24SevenOffice, Access Group, Autodesk, Basecamp, BST Global, Broadcom Inc., Citrix, Computer Methods International Corp., Constellation Software Inc, Dassault Systemes, Datto, Duzon Digitalware, HCL Technologies, IBM, IFS, Ignite Technologies, InEight, KPI Software Inc, Miro, Odoo, Open Text Corporation, Planisware, ProAlpha Business Solutions, Prometheus Group, QuickBase, RIB Software SE, River Logic, Roper Technologies, Runrun.it, Sciforma Corporation, Smartsheet, Sopheon, SS&C Technologies, TeamDynamix, Tigernix Pte Ltd, Trimble, UNIT4, Upland Software, WisageTech, Workcube ERP, Workday, Yonyou, Zoho Corp., and others.
Vendor Snapshot: PPM Market Leaders
 Oracle
Oracle is redefining PPM through an AI-first strategy that embeds autonomous agents within its Primavera Cloud, Aconex and Oracle PPM offerings. These agents continuously monitor project data to detect schedule deviations, forecast resource bottlenecks, and automatically launch mitigation workflows. By transforming the PPM layer into a real-time decision-execution engine, Oracle shifts from static Gantt-driven control to dynamic capital portfolio optimization. Its integration with OCI GenAI services accelerates agentic analytics that guide project governance across engineering, finance, and construction lifecycles.
ServiceNow
ServiceNow integrates agentic AI into its Strategic Portfolio Management (SPM) platform to reframe PPM as a strategic execution hub. AI agents surface value-centric metrics, auto-prioritize initiatives based on business outcomes, and recalibrate portfolio investments via conversational inputs. Its unified workflow engine supports autonomous scenario planning and alignment across digital transformation programs. By fusing natural language strategy design with automated execution, ServiceNow turns PMOs into agents of value realization rather than task oversight.
Atlassian
Atlassian is extending the reach of Jira from agile work management into full-spectrum portfolio governance. AI agents contextualize engineering signals across teams to identify delivery risks, update plans, and recommend trade-offs. The integration of Compass and past acquisitions like Chartio injects data observability into the planning stack. These tools fuel agentic workflows that synchronize execution with strategic goals, while low-code orchestration empowers portfolio leaders to automate governance across product, dev, and ops layers.
Smartsheet
Smartsheet’s evolution into a no-code orchestration engine is driven by its investment in predictive scheduling, resource foresight, and AI-enabled risk surfacing. Its agentic framework empowers teams to define interdependent workstreams where actions like rescheduling or dependency rebalancing are triggered automatically by predictive signals. Through natural language prompts and partner ecosystem APIs, Smartsheet offers a user-centric interface for scaling agentic PPM, from marketing ops to capital project delivery.
Microsoft
Microsoft’s PPM vision pivots from conventional scheduling to intelligent execution within Microsoft Project Online and the broader Microsoft 365 ecosystem. Project managers now leverage conversational interfaces and Copilot-driven planning agents that propose what-if scenarios, auto-update timelines, and align tasks to strategic goals. Through low-code orchestration via Power Platform and embedded analytics from Azure, Microsoft positions PPM as a connected, AI-activated control tower for digital programs and transformation portfolios.
monday.com
Monday.com infuses agentic intelligence across its Work Management suite with predictive models that preempt delays, optimize resource allocations, and automate stakeholder communications. The rollout of Powerscale AI agents and low-code “automation recipes” allow business users to implement autonomous workflows tuned to OKRs, project health, or risk exposure. These capabilities enable monday.com to serve as an adaptive coordination layer for outcome-focused, cross-functional execution.
Procore
Procore’s PPM strategy is vertically optimized for construction, where AI agents now act on procurement and field data to proactively manage cost, safety, and timeline risks. These agents autonomously reroute workflows, suggest material substitutions, and escalate issues ahead of deadlines. With jobsite-aware intelligence and mobile-first interfaces, Procore’s agentic PPM model augments site managers and back-office teams with dynamic, situationally aware decision support.
Asana
Asana’s AI Assistant interprets project health, predicts bottlenecks, and auto-generates summaries and meeting prep across workstreams. Its no-code agent builder enables PMOs to encode dynamic rules that shift assignments or trigger cross-team collaboration when KPIs deviate. By embedding agent-driven workflows in the flow of work, Asana repositions project management as a proactive system of engagement that orchestrates outcomes, not just tasks.
Planview
Planview unifies its PPM Pro and Portfolios offerings with intelligent agents derived from its acquisitions of Aptage and Enrich, creating a generative analytics layer that continuously evaluates scenarios, flags constraints, and simulates trade-offs. Business analysts can now design full autonomous governance flows via low-code, enabling dynamic prioritization and strategic resource reallocation. This signals a shift from reactive PMO reporting to predictive and prescriptive execution control.
SAP
SAP brings agentic AI into its S/4HANA Project System and Portfolio and Project Management (PPM) modules by embedding autonomous workflows that rebalance capital funding, simulate resource impacts, and align execution with enterprise goals. With Joule as a conversational interface and SAP Build Process Automation as the orchestration layer, SAP enables project leaders to interact with data agents that propose actions, execute controls, and ensure strategic compliance across the enterprise core.
ARTW Technographics Platform: PPM customer wins
Since 2010, our research team has been studying the patterns of the Project Portfolio Management software purchases, analyzing customer behavior and vendor performance through continuous win/loss analysis. Updated quarterly, the ARTW Technographics Platform provides deep insights into thousands of PPM customer wins and losses, helping users monitor competitive shifts, evaluate vendor momentum, and make informed go-to-market decisions.
List of PPM customers
Source: ARTW Buyer Insights Technographic Database
Custom data cuts related to the PPM Applications market are available:
- Top 170+ PPM Applications Vendors and Market Forecast 2024-2029
- 2024 PPM Applications Market By Industry (21 Verticals)
- 2024 PPM Applications Market By PPM Segments and Categories
- 2024 PPM Applications Market By Country (USA + 45 countries)
- 2024 PPM Applications Market By Region (Americas, EMEA, APAC)
- 2024 PPM Applications Market By Revenue Type (License, Services, Hardware, Support and Maintenance, Cloud)
- 2024 PPM Applications Market By Customer Size (revenue, employee count, asset)
- 2024 PPM Applications Market By Channel (Direct vs Indirect)
- 2024 PPM Applications Market By Product
Worldwide Enterprise Application Market
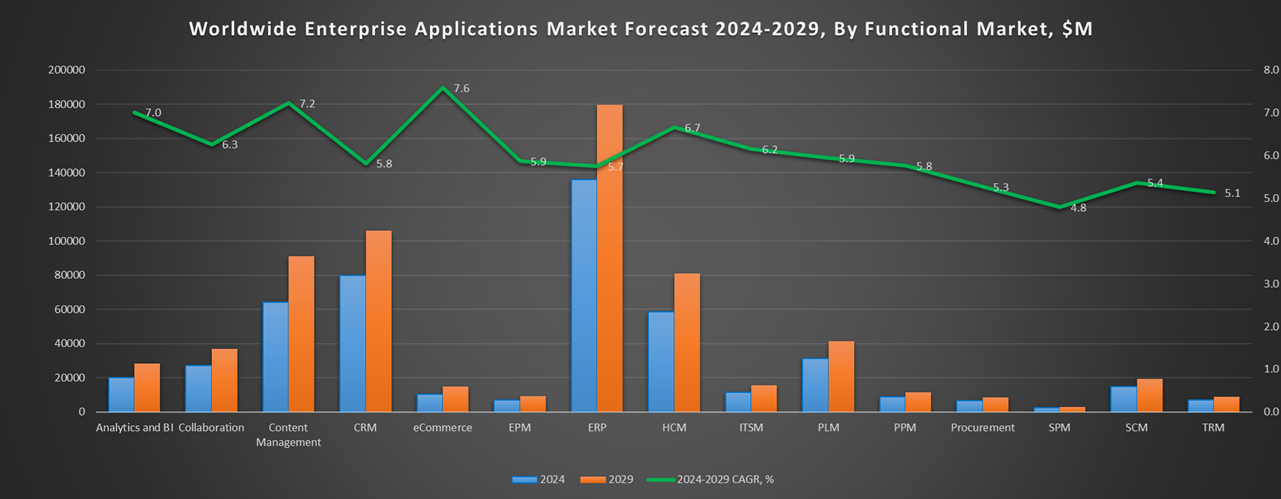
Exhibit 3 provides a forecast of the worldwide enterprise application market from 2024 to 2029, highlighting market sizes, year-over-year growth, and compound annual growth rates across various functional segments. The data shows strong growth in emerging areas like Content Management, eCommerce, Human Capital Management, and IT Service Management, while traditional segments like ERP and CRM continue to dominate in market size.
Exhibit 3: Worldwide Enterprise Application Market Forecast 2024-2029 by Functional Market, $M
Source: Apps Run The World, July 2025
Exhibit 4 shows the enterprise applications market by functional area. The highest growth functional markets revolve around smaller segments like Analytics and BI, eCommerce, Enterprise Performance Management, where first movers remain less established than those that for decades have been entrenched in functional areas like ERP, HCM, CRM and PLM.
FAQ – APPS RUN THE WORLD Top 10 Project Portfolio Management Software Vendors, Market Size & Forecast
Q1. What is the global PPM software market size in 2024?
A: The global PPM applications market was $8.8 billion in 2024, growing 12.7% year-over-year.
Q2. What is the market forecast for PPM through 2029?
A: The PPM market is expected to reach $11.6 billion by 2029, at a 5.8% compound annual growth rate (CAGR) from 2024.
Q3. Who are the top 10 PPM software vendors in 2024, and what share do they hold?
A: The top 10 PPM vendors include Oracle, ServiceNow, Atlassian, Smartsheet, Microsoft, monday.com, Procore, Asana, Planview, and SAP, together capturing 60.5% of the market.
Q4. Which vendor leads the PPM software market in 2024?
A: Oracle leads with approximately 8.5% market share in 2024.
Q5. What functions are included in the PPM market scope?
A: PPM covers initiating, planning/scheduling, allocating, monitoring, and measuring project activities and resources, plus portfolio optimization and some overlap with IT service management.
Q6. What portion of the PPM market is controlled by the top 10 vendors?
A: The top 10 vendors control about 60.5% of the PPM software market in 2024, indicating moderate vendor concentration.
Q7. When was this PPM report published and by whom?
A: The Top 10 PPM Software Vendors, Market Size & Forecast 2024–2029 report was published July 23, 2025, by APPS RUN THE WORLD analysts Albert Pang, Misho Markovski, and Marija Markovska, as part of the APPS TOP 500 research program, which benchmarks the revenues and market share of the world’s 1,500+ largest enterprise application vendors.
More Enterprise Applications Research Findings
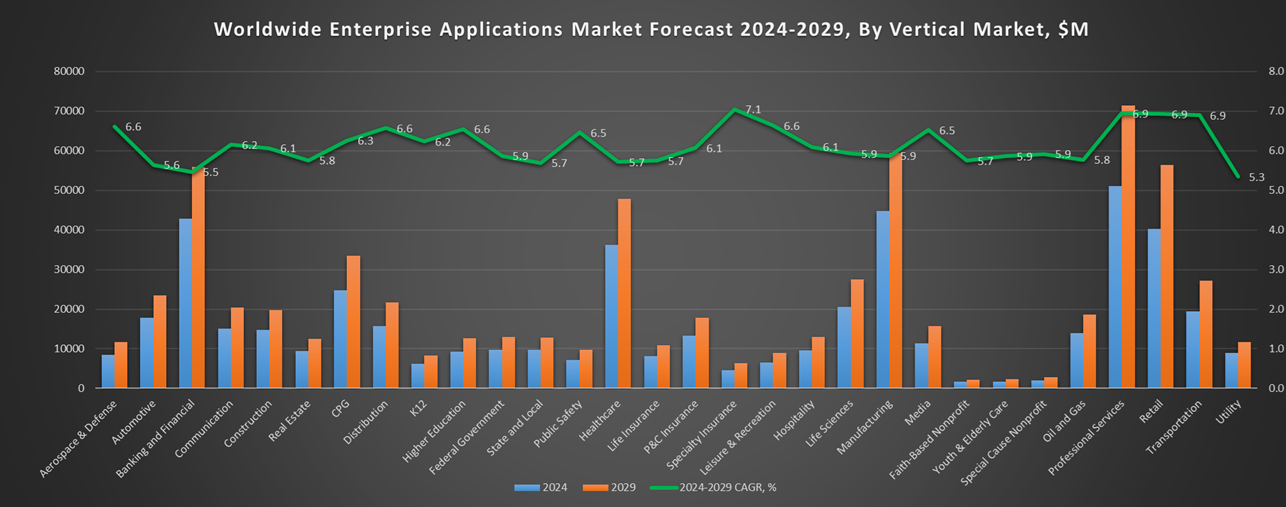
Based on the latest annual survey of 10,000+ enterprise software vendors, Apps Run The World is releasing a number of dedicated reports, which profile the world’s 1,500 largest Enterprise Applications Vendors ranked by their 2024 product revenues. Their 2024 results are being broken down, sorted and ranked across 16 functional areas (from Analytics and BI to Treasury and Risk Management) and by 21 vertical industries (from Aerospace to Utility), as shown in our Taxonomy. Further breakdowns by subvertical, country, company size, etc. are available as custom data cuts per special request.
Research Methodology
Each year our global team of researchers conduct an annual survey of thousands of enterprise software vendors by contacting them directly on their latest quarterly and annual revenues by country, functional area, and vertical market.
We supplement their written responses with our own primary research to determine quarterly and yearly growth rates, In addition to customer wins to ascertain whether these are net new purchases or expansions of existing implementations.
Another dimension of our proactive research process is through continuous improvement of our customer database, which stores more than one million records on the enterprise software landscape of over 2 million organizations around the world.
The database provides customer insight and contextual information on what types of enterprise software systems and other relevant technologies are they running and their propensity to invest further with their current or new suppliers as part of their overall IT transformation projects to stay competitive, fend off threats from disruptive forces, or comply with internal mandates to improve overall enterprise efficiency.
The result is a combination of supply-side data and demand-generation customer insight that allows our clients to better position themselves in anticipation of the next wave that will reshape the enterprise software marketplace for years to come.
- CSL, a Australia based Life Sciences organization with 32000 Employees
- Planisware, a France based Professional Services company with 750 Employees
- Redwood Capital Managem, a United States based Leisure and Hospitality organization with 10 Employees
| Logo | Company | Industry | Employees | Revenue | Country | Evaluated |
|---|
