
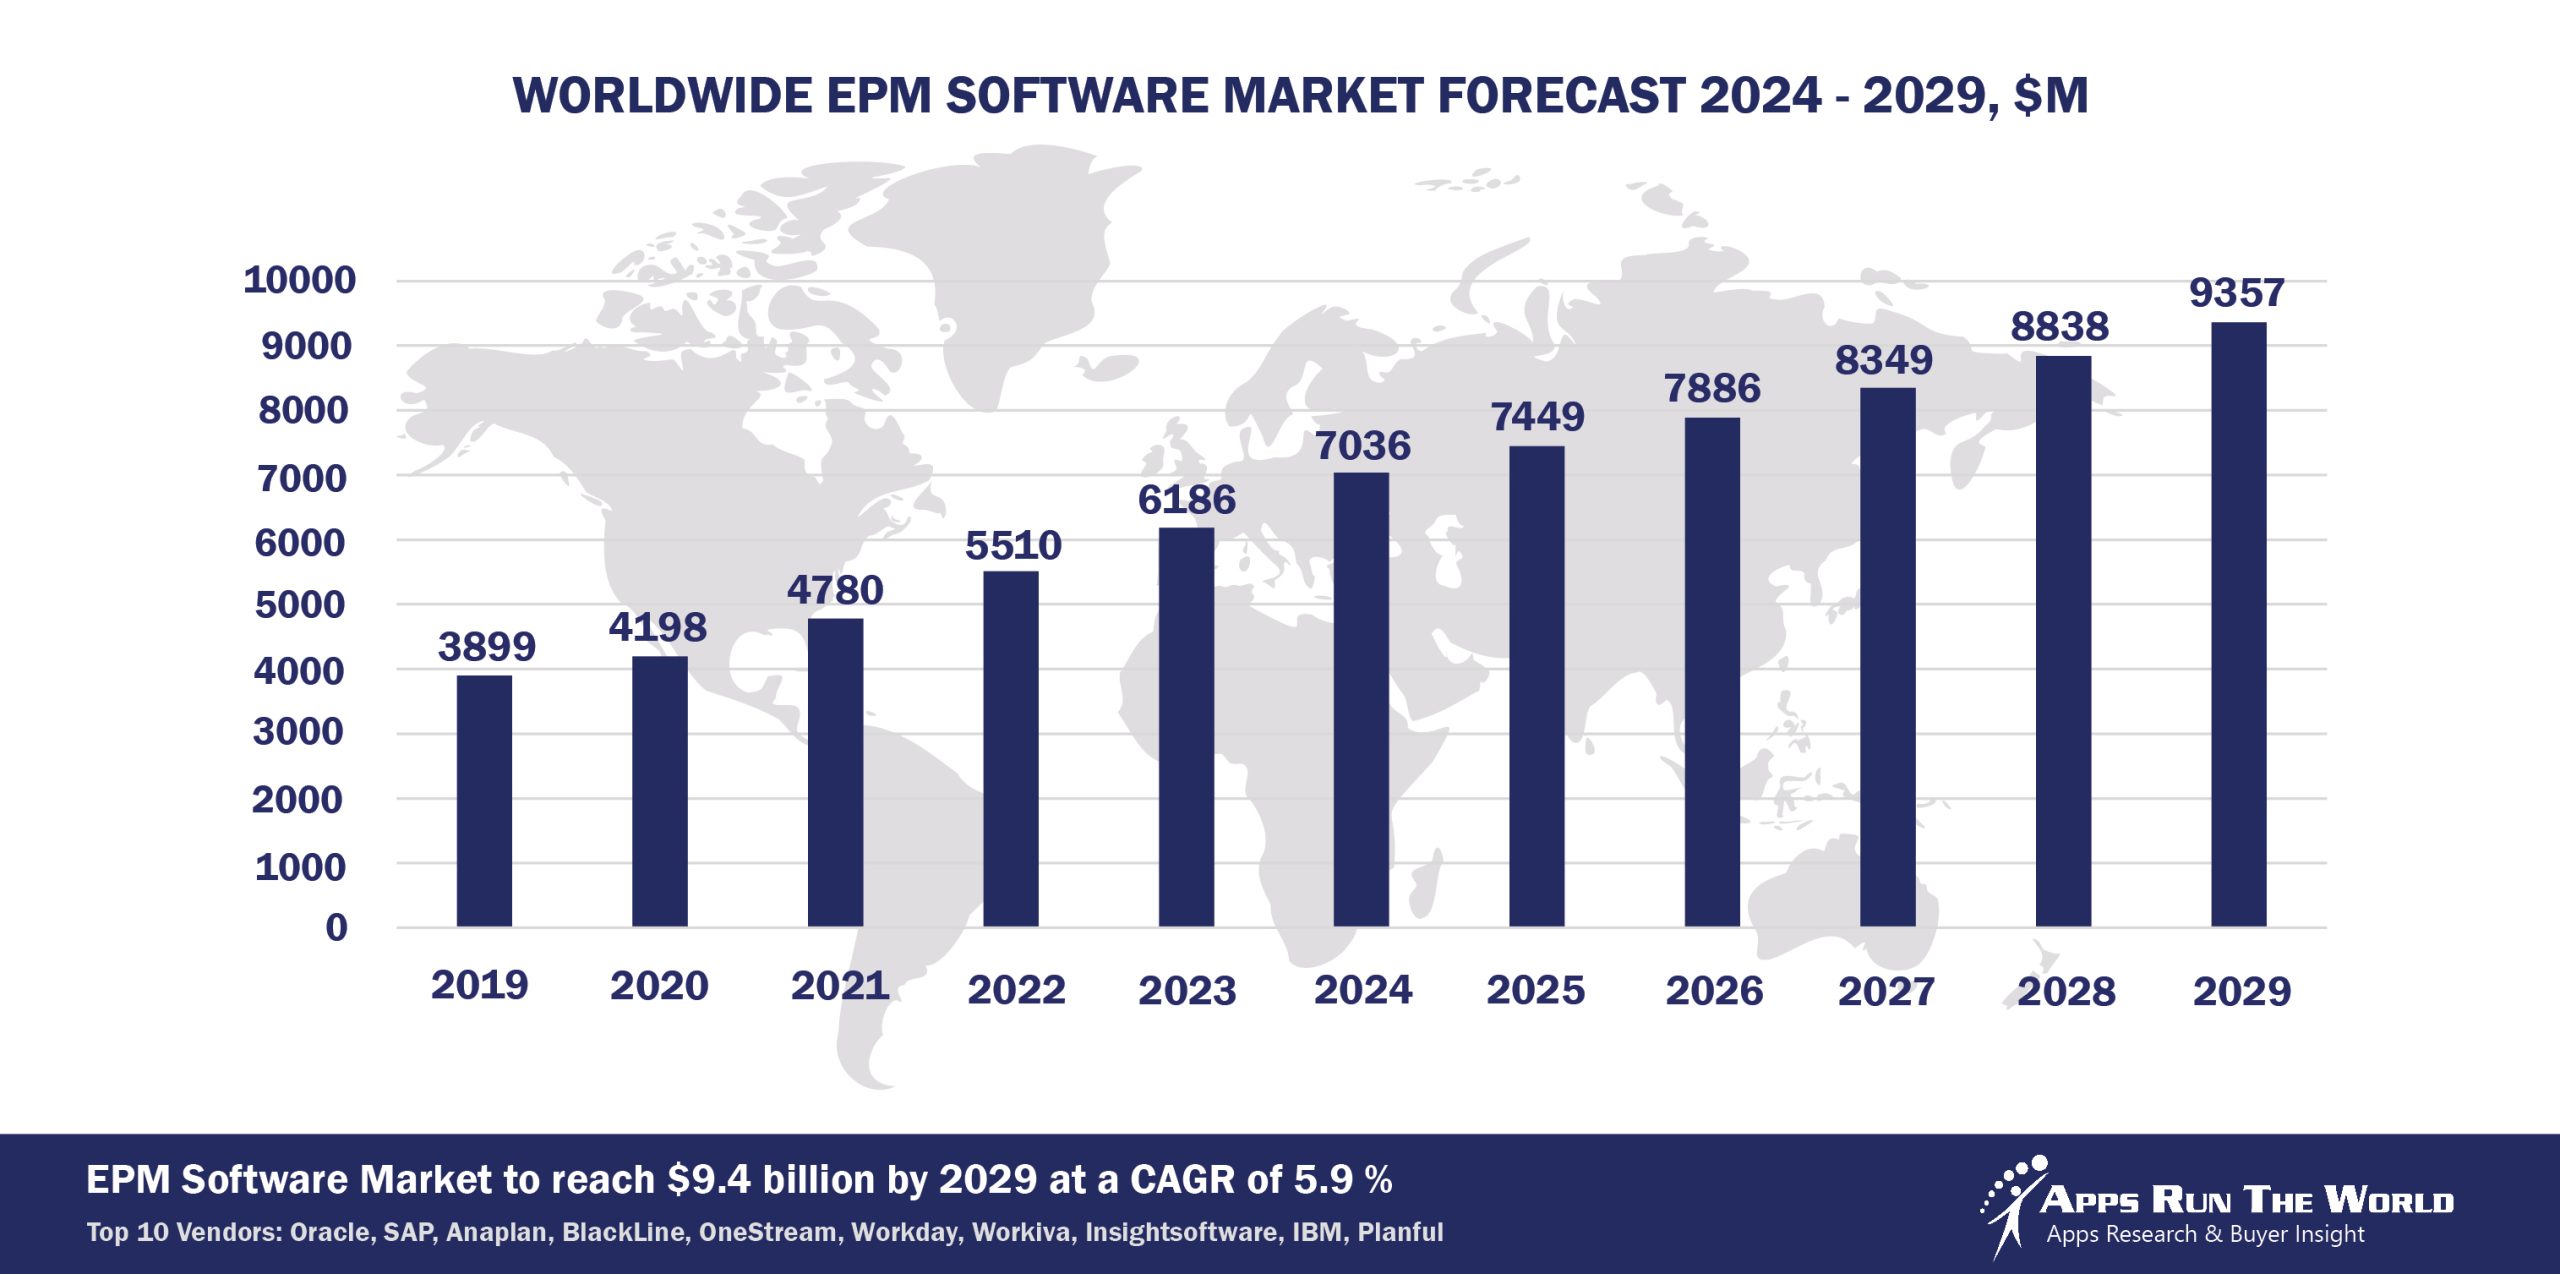
In 2024, the global EPM software market grew to $7 billion, marking a 13.7% year-over-year increase. The top 10 vendors accounted for 77.9% of the total market. Oracle led the pack with a 20.3% market share, followed by SAP, Anaplan, BlackLine, and OneStream Software.
Through our forecast period, the EPM applications market size is expected to reach $9.4 billion by 2029, compared with $7 billion in 2024 at a CAGR of 5.9%, as shown in the Apps Top 500 Report – Excel Edition [Preview] .
EPM applications revenues represent a major contributor to the Enterprise Resource Planning market as part of our market sizing exercise. EPM is moving beyond the finance operations to tackle a full range of budgeting, forecasting and planning challenges with Cloud apps that aim to address Excel-based EPM shortcomings for sales, human resources and operational executives.
Top 10 EPM Software Vendors in 2024 and their Market Shares
Source: Apps Run The World, July 2025
Other EPM software providers included in the report are Alfa Financial Software, Aptos, Bitam, BlackLine, Board International, CAMMS, Centage, Clearwater Analytics, Comarch, Corporater, Craneware, Jedox, Limelight Software, Logibec, MedeAnalytics, More4apps, Quorum Software, Quantrix, Phocas Software, Prophix Software, Roper Technologies, SAS Institute, Sage, SEAC SPA, Sênior Sistemas, Talentia Software, TechnologyOne, UNIT4, Vena Solutions, Vizient, Yonyou and others.
Vendor Snapshot: EPM Market Leaders
 Oracle
Oracle is redefining EPM by embedding agentic AI as autonomous collaborators within its finance ecosystem. The latest release introduces a natural-language PCM Agent that executes complex modeling and allocation tasks with minimal human input. Oracle’s AI Agent Studio and its extensive agent portfolio orchestrate workflows across finance, supply chain, HR, and ERP, seamlessly integrating with third-party systems under strict governance frameworks. This shift signals a move from traditional, static planning tools toward a proactive, AI-driven platform where autonomous agents drive decision-making and operational execution, underpinning Oracle’s go-to-market focus on enterprise-grade intelligent automation.
SAP
SAP’s EPM innovation centers on its newly launched AI operating system and omnipresent copilot, Joule, which, alongside a network of autonomous agents, executes cross-functional business processes without custom coding. Emphasizing regulated, low-code agent deployment, SAP integrates conversational AI and end-to-end autonomous workflows to streamline finance, supply chain, procurement, and HR functions. This agent-driven approach supports composable architectures and positions SAP as a leader in embedding AI-powered autonomy into complex enterprise environments, tightly aligning its product roadmap with emerging agentic technologies and compliance demands.
Anaplan
Anaplan is advancing connected planning through predictive, generative, and agentic AI that empowers business analysts with natural language interfaces to surface insights, optimize scenarios, and recalibrate plans dynamically. Its agent-first workflows enable low-code, self-service orchestration across finance, sales, ESG, and operations, uniting analytics and execution in a seamless experience. By embedding autonomous agents as strategic collaborators, Anaplan evolves from a planning tool to an intelligent, adaptive platform, promoting agile decision-making and continuous optimization in complex, data-driven environments.
BlackLine
BlackLine’s expansion into agentic AI targets automation within record-to-report and invoice-to-cash processes by embedding agents that autonomously interpret data, flag anomalies, and surface audit risks. This agent-centric automation reduces manual efforts while ensuring rigorous compliance and auditability, transforming finance operations into intelligent, governance-driven workflows. BlackLine’s roadmap positions autonomous agents as enforcers of finance controls, embedding intelligent decision support to enhance accuracy, speed, and transparency throughout the close and reconciliation lifecycle.
OneStream Software
OneStream’s agent-first strategy unfolds with SensibleAI Agents that mimic finance analyst behaviors—proactively analyzing performance and unstructured data to generate real-time insights. The platform’s no-code forecasting agents and autonomous commentary capabilities support conversational scenario modeling and narrative generation, tightly integrating planning, consolidation, and analytics within a unified architecture. This evolution toward autonomous intelligence highlights OneStream’s commitment to seamless AI-driven financial processes and an agent-embedded CPM platform that adapts continuously to business changes.
Workday
Workday is evolving its EPM platform into an intelligent planning and decisioning environment centered on embedded AI agents, predictive forecasting, and self-configuring models. Within Adaptive Planning, agents are now capable of automatically ingesting operational drivers, simulating multi-scenario outcomes, and refining forecasts in response to real-time business inputs, reducing the dependency on static models or manual recalibration. The introduction of conversational interfaces allows business users to query plan variances, initiate budget reforecasts, and automate workflow approvals via natural language prompts, while behind the scenes, agents orchestrate data pipelines, model transformations, and decision tracking. Workday’s roadmap emphasizes a modular approach to autonomous analytics, with a growing focus on low-code agent configurability and a centralized governance layer to ensure explainability and compliance across planning cycles.
Workiva
Workiva integrates generative and agentic AI into its reporting platform to automate narrative generation, audit trail suggestions, and compliance disclosures, transcending traditional document assembly. Conversational AI interfaces enable users to interact naturally with complex financial and ESG data while maintaining strict governance. Autonomous agents produce insights and refine audit evidence in situ, fostering a unified, AI-augmented environment that enhances transparency, accelerates reporting cycles, and supports continuous assurance.
Insightsoftware
With the recent acquisition of JustPerform, insightsoftware enriches its EPM offerings by embedding AI-driven predictive analytics and no-code planning tools into a cloud-native environment. Its AI companion, Lineos, autonomously summarizes data, generates reports, and recommends actionable steps, enabling finance teams to operate proactively. The vendor’s strategy highlights low-code deployment and data lineage transparency, ensuring AI-augmented decision support is tightly integrated into CFO workflows, reinforcing InsightSoftware’s focus on user empowerment and autonomous financial management.
IBM
IBM repositions its Cognos TM1/Planning Analytics with deeper integration of Watson AI to embed agentic intelligence throughout planning workflows. Autonomous agents generate modeling recommendations, detect anomalies, and propose corrective actions via accessible low-code interfaces. IBM’s roadmap converges traditional on-prem EPM capabilities with cloud-native, agent-driven autonomy, fostering a hybrid environment where classic financial planning meets AI-powered predictive and prescriptive analytics.
Planful (formerly Host Analytics)
Planful enhances its planning and consolidation modules with AI-powered assistants that autonomously trigger alerts, initiate tasks, and generate narrative insights into financial variances. While more discreet in announcements, its strategic focus is clear: embedding conversational, adaptive agents that enable business users to configure autonomous workflows without coding. This approach positions Planful as a platform evolving toward seamless, agent-driven planning and close management designed for agility and user empowerment.
ARTW Technographics Platform: EPM customer wins
Since 2010, our research team has been studying the patterns of the EPM software purchases, analyzing customer behavior and vendor performance through continuous win/loss analysis. Updated quarterly, the ARTW Technographics Platform provides deep insights into thousands of EPM customer wins and losses, helping users monitor competitive shifts, evaluate vendor momentum, and make informed go-to-market decisions.
List of EPM customers
Source: ARTW Buyer Insights Technographic Database
Custom data cuts related to the EPM Applications market are available:
- Top 100+ EPM Applications Vendors and Market Forecast 2024-2029
- 2024 EPM Applications Market By Industry (21 Verticals)
- 2024 EPM Applications Market By EPM Segments and Categories
- 2024 EPM Applications Market By Country (USA + 45 countries)
- 2024 EPM Applications Market By Region (Americas, EMEA, APAC)
- 2024 EPM Applications Market By Revenue Type (License, Services, Hardware, Support and Maintenance, Cloud)
- 2024 EPM Applications Market By Customer Size (revenue, employee count, asset)
- 2024 EPM Applications Market By Channel (Direct vs Indirect)
- 2024 EPM Applications Market By Product
Worldwide Enterprise Application Market
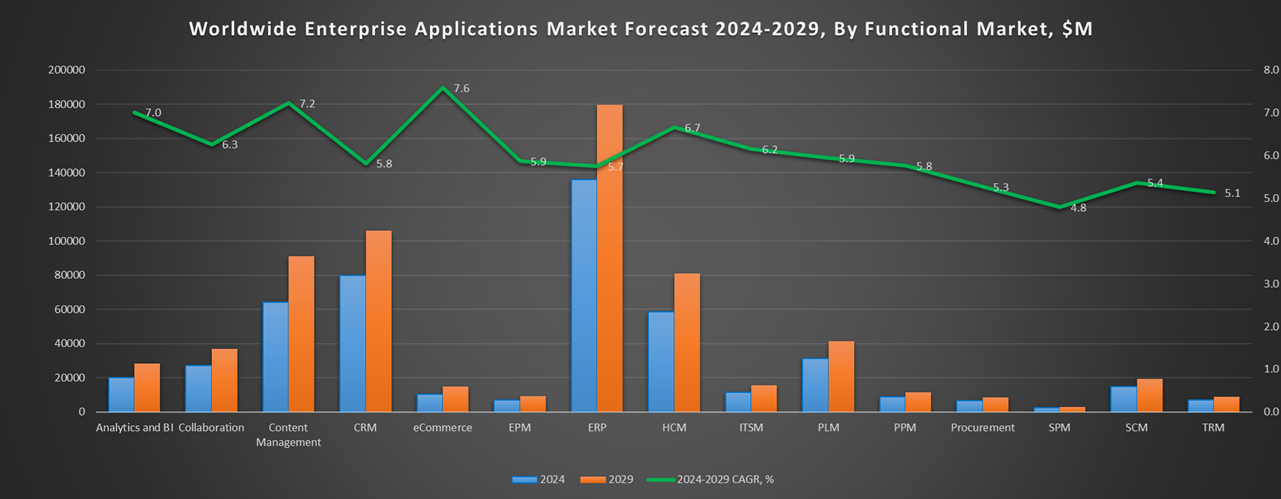
Exhibit 3 provides a forecast of the worldwide enterprise application market from 2024 to 2029, highlighting market sizes, year-over-year growth, and compound annual growth rates across various functional segments. The data shows strong growth in emerging areas like Content Management, eCommerce, Human Capital Management, and IT Service Management, while traditional segments like ERP and CRM continue to dominate in market size.
Exhibit 3: Worldwide Enterprise Application Market Forecast 2024-2029 by Functional Market, $M
Source: Apps Run The World, July 2025
Exhibit 4 shows the enterprise applications market by functional area. The highest growth functional markets revolve around smaller segments like Analytics and BI, eCommerce, Enterprise Performance Management, where first movers remain less established than those that for decades have been entrenched in functional areas like ERP, HCM, CRM and PLM.
FAQ – APPS RUN THE WORLD Top 10 EPM Software Vendors, Market Size & Forecast
Q1. What is the global EPM software market size in 2024?
A: The global EPM (Enterprise Performance Management) software market reached $7.0 billion in 2024, growing 13.7% year-over-year.
Q2. What is the forecasted market size and CAGR for EPM through 2029?
A: The EPM applications market is expected to reach $9.4 billion by 2029, up from $7.0 billion in 2024, at a 5.9% compound annual growth rate.
Q3. Who are the top 10 EPM software vendors in 2024, and what share do they hold?
A: The top 10 EPM vendors in 2024 include Oracle, SAP, Anaplan, BlackLine, OneStream Software, Workday, Workiva, Insightsoftware, IBM, and Planful, together accounting for about 77.9% of the total market.
Q4. Which vendor leads the EPM market, and what is its share?
A: Oracle leads the EPM market in 2024 with 20.3% market share.
Q5. How is EPM expanding beyond traditional finance functions?
A: EPM is evolving beyond finance to include budgeting, forecasting, and planning challenges across sales, HR, and operations via cloud apps addressing limitations of Excel-based tools.
Q6. Which other EPM vendors are covered beyond the top 10?
A: The report also covers vendors such as Vena Solutions, Pigment, Board International, Tagetik, and Jedox, among others.
Q7. When was this EPM report published, and who produced it?
A: The Top 10 EPM Software Vendors, Market Size & Forecast 2024–2029 report was published July 23, 2025, by APPS RUN THE WORLD, authored by Albert Pang, Misho Markovski, and Milena Kostadinovski.
More Enterprise Applications Research Findings
Based on the latest annual survey of 10,000+ enterprise software vendors, Apps Run The World is releasing a number of dedicated reports, which profile the world’s 1,500 largest Enterprise Applications Vendors ranked by their 2024 product revenues. Their 2024 results are being broken down, sorted and ranked across 16 functional areas (from Analytics and BI to Treasury and Risk Management) and by 21 vertical industries (from Aerospace to Utility), as shown in our Taxonomy. Further breakdowns by subvertical, country, company size, etc. are available as custom data cuts per special request.
Research Methodology
Each year our global team of researchers conduct an annual survey of thousands of enterprise software vendors by contacting them directly on their latest quarterly and annual revenues by country, functional area, and vertical market.
We supplement their written responses with our own primary research to determine quarterly and yearly growth rates, In addition to customer wins to ascertain whether these are net new purchases or expansions of existing implementations.
Another dimension of our proactive research process is through continuous improvement of our customer database, which stores more than one million records on the enterprise software landscape of over 2 million organizations around the world.
The database provides customer insight and contextual information on what types of enterprise software systems and other relevant technologies are they running and their propensity to invest further with their current or new suppliers as part of their overall IT transformation projects to stay competitive, fend off threats from disruptive forces, or comply with internal mandates to improve overall enterprise efficiency.
The result is a combination of supply-side data and demand-generation customer insight that allows our clients to better position themselves in anticipation of the next wave that will reshape the enterprise software marketplace for years to come.
- Wolters Kluwer, a Netherlands based Professional Services organization with 21100 Employees
- Bundesbeschaffung, a United States based Government company with 191 Employees
- Sharobella, a Austria based Retail organization with 480 Employees
| Logo | Company | Industry | Employees | Revenue | Country | Evaluated |
|---|
