
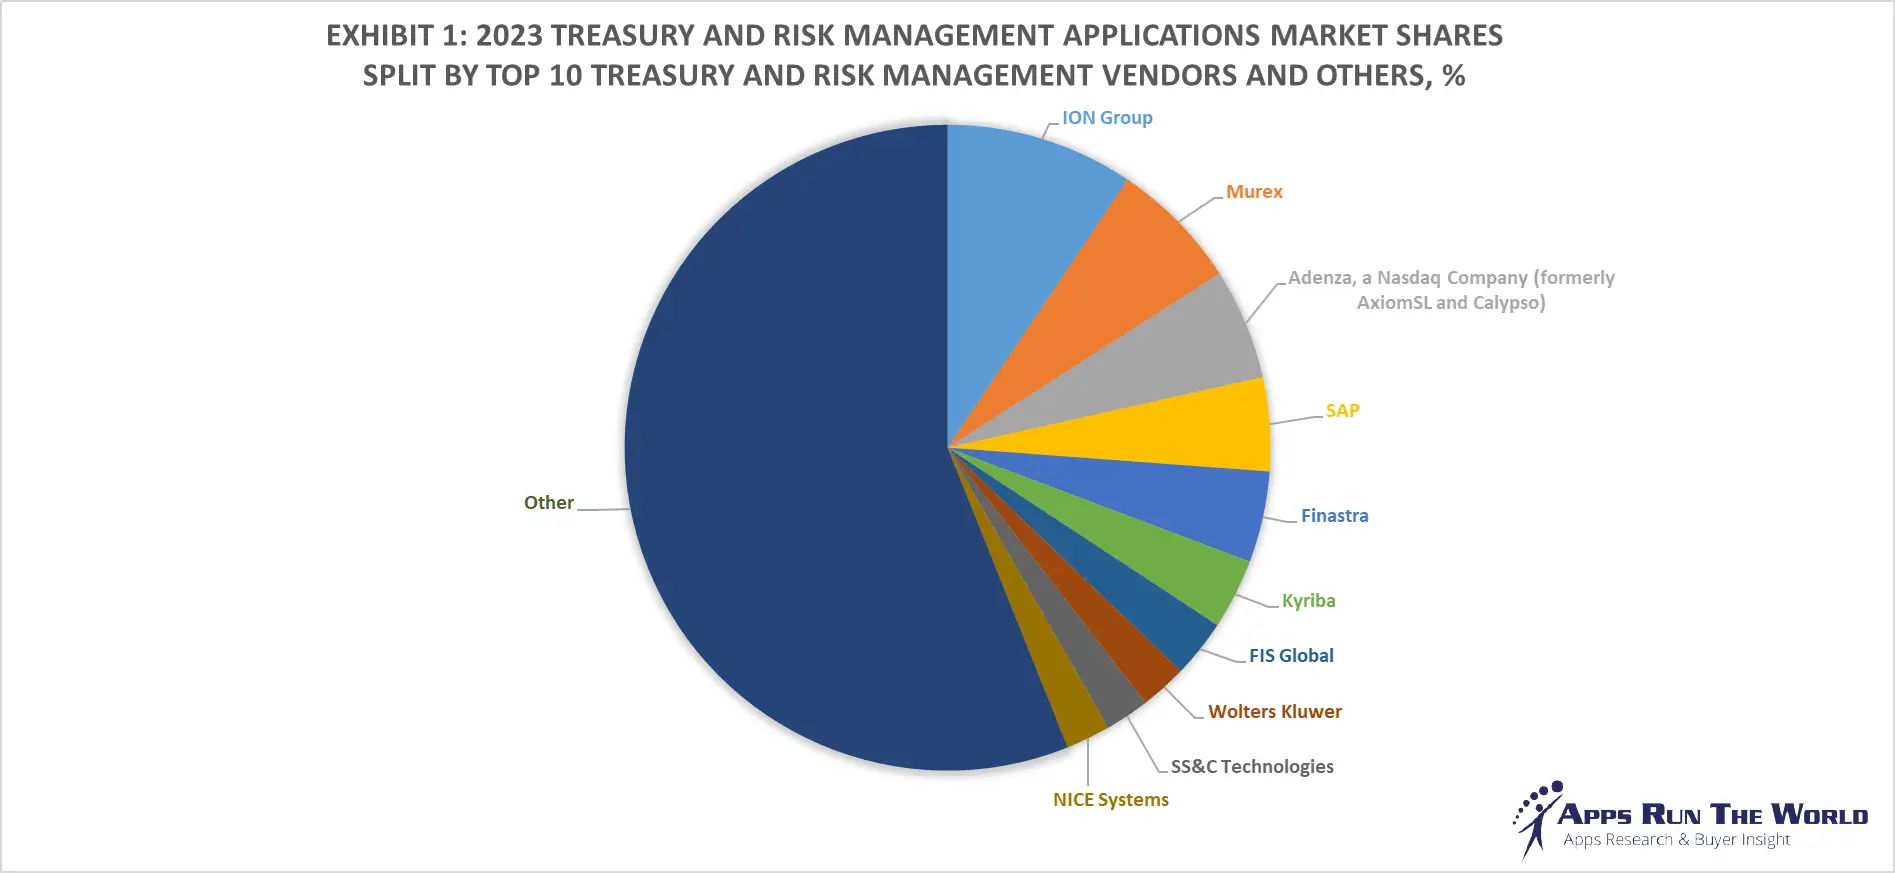
In 2023, the global Treasury and Risk Management (TRM) software market surged to nearly $5.9 billion, growing by 7.4%. The top 10 vendors commanded a significant 43.9% market share, with ION Group leading at 9.4%, followed by Murex, Adenza (formerly AxiomSL and Calypso), SAP and Finastra.
Our APPS TOP 500 Market Report (Preview) covers hundreds of TRM software vendors, offering deep insights into market dynamics, vendor strengths, AI investments, customer momentum, and go-to-market strategies providing valuable perspectives on market trends and challenges.
Discover thousands of TRM Customer Wins with the ARTW Technographics Platform, an essential resource for technology enthusiasts, sales business leaders, and data-driven marketing executives, offering curated insights into the evolving landscape of the software industry, including the latest developments in TRM.
Through our forecast period, the TRM applications market size is expected to reach $6.6 billion by 2028, compared with $5.9 billion in 2023 at a compound annual growth rate of 2%.
| Exhibit 2: Worldwide TRM Software Market 2023-2028 Forecast, $M | |||
|---|---|---|---|
| Year | 2023 | 2028 | 2023-2028 CAGR, % |
| Total | 5942 | 6569 | 2% |
Source: Apps Run The World, June 2024
Top 10 TRM Software Vendors
Treasury and Risk Management applications covers standalone and/or integrated products that automate business processes to support corporate treasury operations (including the treasuries of financial services enterprises) with the corresponding financial institution functionality and optimize related cash management, deal management, and risk management functions.
Financial services remain TRM’s biggest buyers, FIS’ purchase of SunGard forming a juggernaut in TRM will reshape the marketplace. On the other hand, fintech startups such as TreasuryXpress are having record sales contract increase across the Americas, EMEA, and MENA regions for their enterprise treasury management solution.
Here are the rankings of the top 10 TRM software vendors in 2023 and their market shares.
| Rank | Vendor | 2021 TRM Apps Revenues, $M | 2022 TRM Apps Revenues, $M | 2023 TRM Apps Revenues, $M | YoY Growth | 2023 TRM Market Share, % |
|---|---|---|---|---|---|---|
| 1 | ION Group | Subscribe | Subscribe | Subscribe | 4.9% | Subscribe |
| 2 | Murex | Subscribe | Subscribe | Subscribe | 3.2% | Subscribe |
| 3 | Adenza, a Nasdaq Company (formerly AxiomSL and Calypso) | Subscribe | Subscribe | Subscribe | 3.6% | Subscribe |
| 4 | SAP | Subscribe | Subscribe | Subscribe | 3.6% | Subscribe |
| 5 | Finastra | Subscribe | Subscribe | Subscribe | 7.7% | Subscribe |
| 6 | Kyriba | Subscribe | Subscribe | Subscribe | 13.2% | Subscribe |
| 7 | FIS Global | Subscribe | Subscribe | Subscribe | 3.5% | Subscribe |
| 8 | Wolters Kluwer | Subscribe | Subscribe | Subscribe | 9.3% | Subscribe |
| 9 | SS&C Technologies | Subscribe | Subscribe | Subscribe | 6.3% | Subscribe |
| 10 | NICE Systems | Subscribe | Subscribe | Subscribe | 12.4% | Subscribe |
| Subtotal | Subscribe | Subscribe | Subscribe | 5.8% | Subscribe | |
| Other | Subscribe | Subscribe | Subscribe | 8.6% | Subscribe | |
| Total | 5176 | 5534 | 5942 | 7.4% | 100.0% |
Source: Apps Run The World, June 2024
Other TRM software providers included in the report are: 3i Infotech, 3V Finance (Titan Treasury), ACI Worldwide, Argo Data Resource Corp., Asseco Group, Bloomberg, Bottomline Technologies, Calabrio, Inc., CGI Group Inc., Coupa Software, Clearwater Analytics, COCC, CURA Software Solutions, Deluxe Corporation, Digital River, Edgeverve, an Infosys company, Envestnet, Equifax, Exalog, Exela Technologies, Exigis, Experian, FICO, Fiserv, GTreasury, GBST Holdings Limited, HCL Technologies Ltd., IBM, Imagine Software, Infor, Intelex Technologies, Jack Henry & Associates, KOGER, LexisNexis, Milliman Marc, MSCI, NCR Corporation, Oracle, Resolver Inc., Riskonnect, Roper Technologies, Salmon Software, Sage, Serrala, SimCorp, Silverlake Axis, SAS Institute, SmartStream, Solera Holdings, Temenos Group AG, Thomson Reuters Elite, Trayport, Trintech Group, Verint Systems Inc., Workiva, Yonyou, and others.
Custom data cuts related to the Treasury and Risk Management Applications market are available:
- Top 130+ TRM Applications Vendors and Market Forecast 2023-2028
- 2023 TRM Applications Market By Industry (21 Verticals)
- 2023 TRM Applications Market By TRM Segments and Categories
- 2023 TRM Applications Market By Country (USA + 45 countries)
- 2023 TRM Applications Market By Region (Americas, EMEA, APAC)
- 2023 TRM Applications Market By Revenue Type (License, Services, Hardware, Support and Maintenance, Cloud)
- 2023 TRM Applications Market By Customer Size (revenue, employee count, asset)
- 2023 TRM Applications Market By Channel (Direct vs Direct)
- 2023 TRM Applications Market By ProductBuyer Intent: Companies Reading this Research ReportARTW Buyer Intent uncovers actionable customer signals, identifying software buyers actively reading this research report. Gain ongoing access to real-time prospects and uncover hidden opportunities. Companies Actively accessing this research report include:
- Millennium, a United States based Banking and Financial Services organization with 6100 Employees
- e-mansion, a Japan based Professional Services company with 100 Employees
- Macquarie Bank, a Australia based Banking and Financial Services organization with 20000 Employees
Logo Company Industry Employees Revenue Country Evaluated Worldwide Enterprise Application Market
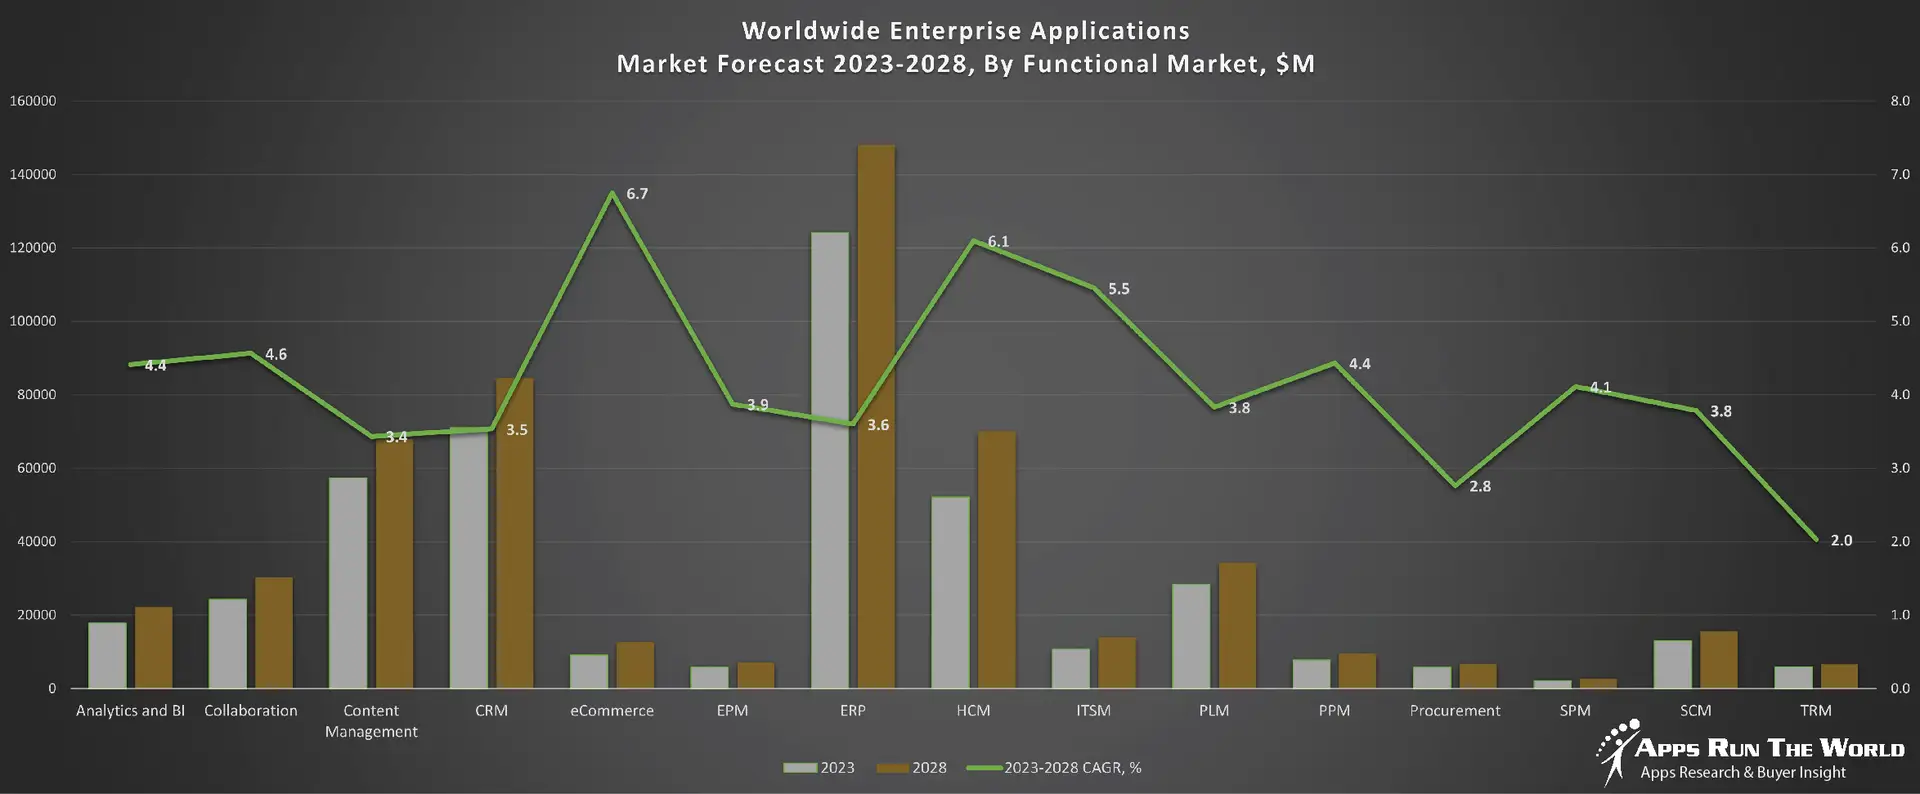
Exhibit 3 provides a forecast of the worldwide enterprise application market from 2023 to 2028, highlighting market sizes, year-over-year growth, and compound annual growth rates across various functional segments. The data shows strong growth in emerging areas like eCommerce, Human Capital Management, and IT Service Management, while traditional segments like ERP and CRM continue to dominate in market size.
Exhibit 3: Worldwide Enterprise Application Market Forecast 2023-2028 by Functional Market ($M)
Source: Apps Run The World, June 2024
Exhibit 4 shows the enterprise applications market by functional area. The highest growth functional markets revolve around smaller segments like eCommerce, Enterprise Performance Management, Sales Performance Management and Treasury and Risk, where first movers remain less established than those that for decades have been entrenched in functional areas like Analytics and BI, ERP, CRM and PLM.
TRM Win/Loss Analysis As Part Of Enterprise Applications Buyer Insight Customer Database
On the buyer side, customers are investing in TRM systems based on new features and capabilities that are expected to replace their existing legacy systems. In many cases, competitive upgrades and replacements that could have a profound impact on future market-share changes will become more widespread.
Since 2010, our global team of researchers have been studying the patterns of the latest TRM software purchases by customers around the world, aggregating massive amounts of data points that form the basis of our forecast assumptions and perhaps the rise and fall of certain vendors and their products on a quarterly basis.
Updated continuously, our database features extensive win/loss analysis. Each year our research team identifies tens of thousands of these TRM customer wins and losses from public and proprietary sources.
The research results are being incorporated into regular updates in our Enterprise Applications Buyer Insight Customer Database. You can access the Quarterly Win/Loss Analysis Scoreboard and our Enterprise Applications Buyer Insight Customer Database by becoming a subscriber.
Source: Apps Run The World, June 2024
More Enterprise Applications Research Findings
Based on the latest annual survey of 3,000+ enterprise software vendors, Apps Run The World is releasing a number of dedicated reports, which profile the world’s 500 largest Enterprise Applications Vendors (Apps Top 500) ranked by their 2019-2023 product revenues.
Their 2023 results are being broken down, sorted and ranked across 16 functional areas (from Analytics to Treasury and Risk Management) and by 21 vertical industries(from Aerospace to Utility), as shown in our Taxonomy. Further breakdowns by subvertical, country, company size, etc. are available as custom data cuts per special request.
Definition Of Treasury And Risk Management (TRM) Applications
Treasury and Risk Management applications are designed to automate corporate and banking functions pertaining to managing cash and liquidity, identifying and measuring financial risks as well as other assets, collaterals and underlying instruments that could impact an organization’s ability to sustain itself financially and operationally, while meeting regulatory requirements.

The market for treasury and risk management applications covers standalone and/or integrated products that automate business processes to support corporate treasury operations (including the treasuries of financial services enterprises) with the corresponding financial institution functionality and optimize related cash management, deal management, and risk management functions as follows:
- Cash management automation includes both discrete and interlocking treasury processes involving electronic payment authorization, bank relationship management, cash forecasting, and others.
- Deal management automation includes processes for the implementation of trading controls, the creation of new instruments and asset classes, market data interface from manual or third-party sources, and others.
- Risk management automation includes performance analysis, various metrics calculations used in fixed-income portfolio analysis, market-to-market valuations, energy trading and risk management, and compliance with regulations and standards such as Basel III, Dodd Frank, European Market Infrastructure Regulation, Financial Accounting Standard, International Financial Reporting Standards, Single European Payments Area, Solvency II, and others.
Research Methodology
Each year our global team of researchers conduct an annual survey of thousands of enterprise software vendors by contacting them directly on their latest quarterly and annual revenues by country, functional area, and vertical market. We supplement their written responses with our own primary research to determine quarterly and yearly growth rates, In addition to customer wins to ascertain whether these are net new purchases or expansions of existing implementations.
Another dimension of our proactive research process is through continuous improvement of our customer database, which stores more than one million records on the enterprise software landscape of over 100,000 organizations around the world. The database provides customer insight and contextual information on what types of enterprise software systems and other relevant technologies are they running and their propensity to invest further with their current or new suppliers as part of their overall IT transformation projects to stay competitive, fend off threats from disruptive forces, or comply with internal mandates to improve overall enterprise efficiency.
The result is a combination of supply-side data and demand-generation customer insight that allows our clients to better position themselves in anticipation of the next wave that will reshape the enterprise software marketplace for years to come.
