
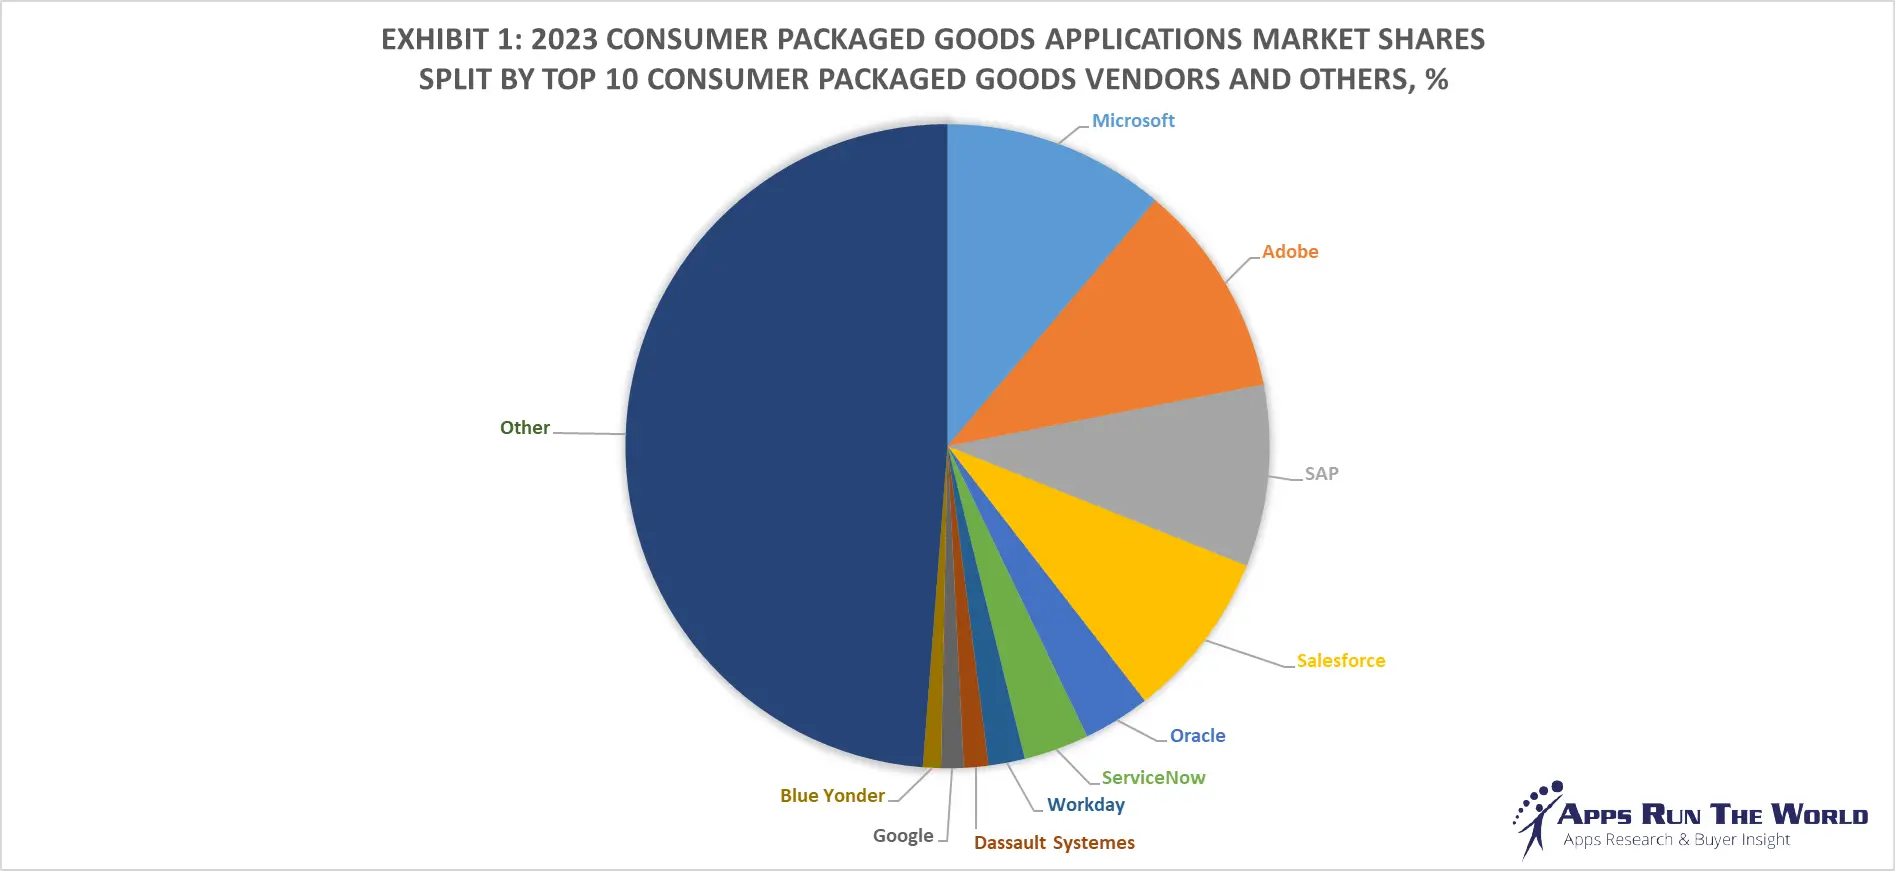
In 2023, the global Consumer Packaged Goods applications market surged to nearly $21.7 billion, growing by 11.2%. The top 10 vendors commanded a significant 51.2% market share, with Microsoft leading at 11.2%, followed by Adobe, SAP, Salesforce, and Oracle.
Our APPS TOP 500 Market Report (Preview) covers thousands of Consumer Packaged Goods software vendors, offering deep insights into market dynamics, vendor strengths, AI investments, customer momentum, and go-to-market strategies providing valuable perspectives on market trends and challenges.
Discover thousands of Consumer Packaged Goods Customer Wins with the ARTW Technographics Platform, an essential resource for technology enthusiasts, sales business leaders, and data-driven marketing executives, offering curated insights into the evolving landscape of the software industry, including the latest developments in Consumer Packaged Goods.
Through our forecast period, the Consumer Packaged Goods applications market size is expected to reach $27.1 billion by 2028, compared with $21.7 billion in 2023 at a compound annual growth rate of 4.5%.
| Exhibit 2: Worldwide Consumer Packaged Goods Software Market 2023-2028 Forecast, $M | |||
|---|---|---|---|
| Year | 2023 | 2028 | 2023-2028 CAGR, % |
| Total | 21747 | 27147 | 4.5% |
Source: Apps Run The World, June 2024
Top 10 Consumer Packaged Goods Software vendors
Consumer & Packaged Goods (Consumer goods including non-durables, apparel, food and beverage and packaged goods) – Product lifecycle management, Supply Chain Management. eCommerce, Pricing Optimization, Financials, HR, Procurement
PLM systems are gaining traction among CPG firms, the same applies to compliance and risk management. Better use of agriculture technology systems, as well as the Internet of Things, could transform the food industry.
Here are the rankings of the top 10 Consumer Packaged Goods software vendors in 2023 and their market shares.
| Rank | Vendor | 2021 Consumer Packaged Goods Apps Revenues, $M | 2022 Consumer Packaged Goods Apps Revenues, $M | 2023 Consumer Packaged Goods Apps Revenues, $M | YoY Growth | 2023 Consumer Packaged Goods Market Share, % |
|---|---|---|---|---|---|---|
| 1 | Microsoft | Subscribe | Subscribe | Subscribe | 7.0% | Subscribe |
| 2 | Adobe | Subscribe | Subscribe | Subscribe | 13.0% | Subscribe |
| 3 | SAP | Subscribe | Subscribe | Subscribe | 5.7% | Subscribe |
| 4 | Salesforce | Subscribe | Subscribe | Subscribe | 14.2% | Subscribe |
| 5 | Oracle | Subscribe | Subscribe | Subscribe | 7.9% | Subscribe |
| 6 | ServiceNow | Subscribe | Subscribe | Subscribe | 18.8% | Subscribe |
| 7 | Workday | Subscribe | Subscribe | Subscribe | 18.7% | Subscribe |
| 8 | Dassault Systemes | Subscribe | Subscribe | Subscribe | 8.9% | Subscribe |
| 9 | Subscribe | Subscribe | Subscribe | 22.9% | Subscribe | |
| 10 | Blue Yonder | Subscribe | Subscribe | Subscribe | 7.0% | Subscribe |
| Subtotal | Subscribe | Subscribe | Subscribe | 10.7% | Subscribe | |
| Other | Subscribe | Subscribe | Subscribe | 11.8% | Subscribe | |
| Total | 17521 | 19552 | 21747 | 11.2% | 100.0% |
Source: Apps Run The World, June 2024
Other Consumer Packaged Goods software providers included in the report are ADP, Ansys Inc., Atlassian, Autodesk, Box Inc., Cisco Systems, Citrix, Cadence Design Systems, Constellation Software Inc., Dassault Systemes, DocuSign, Inc., Dropbox, Famous Software, Genesys Telecommunications Laboratories, Global Payments Inc., Google, HubSpot, Intuit Inc., Infor, IBM, Kibo, Nice Systems, Open Text Corporation, Paycom, Pegasystems, PTC, Property Works, PROS Holdings, Qlik, Sage, Shopify, Siemens Digital Industries Software, SolarWinds, StayinFront, Symphony RetailAI, Teradata Corporation, Trace One, Tugboat Software, UKG, Verint Systems Inc., Visma, Vonage, Yonyou, Workiva, Zendesk, Zoho Corp. and many others.
Custom data cuts related to the Consumer Packaged Goods Applications market are available:
- Top 1000+ Consumer Packaged Goods Applications Vendors and Market Forecast 2023-2028
- 2023 Consumer Packaged Goods Applications Market By Functional Market (16 Markets)
- 2023 Consumer Packaged Goods Applications Market By Country (USA + 45 countries)
- 2023 Consumer Packaged Goods Applications Market By Region (Americas, EMEA, APAC)
- 2023 Consumer Packaged Goods Applications Market By Revenue Type (License, Services, Hardware, Support and Maintenance, Cloud)
- 2023 Consumer Packaged Goods Applications Applications Market By Customer Size (revenue, employee count, asset)
- 2023 Consumer Packaged Goods Applications Market By Channel (Direct vs Direct)
- 2023 Consumer Packaged Goods Applications Market By Product
- Alares Internet, a Brazil based Communications organization with 2700 Employees
- Like, a Italy based Professional Services company with 10 Employees
- Northwest Chinese School, a United States based Education organization with 100 Employees
| Logo | Company | Industry | Employees | Revenue | Country | Evaluated |
|---|
Worldwide Enterprise Applications by Vertical Market
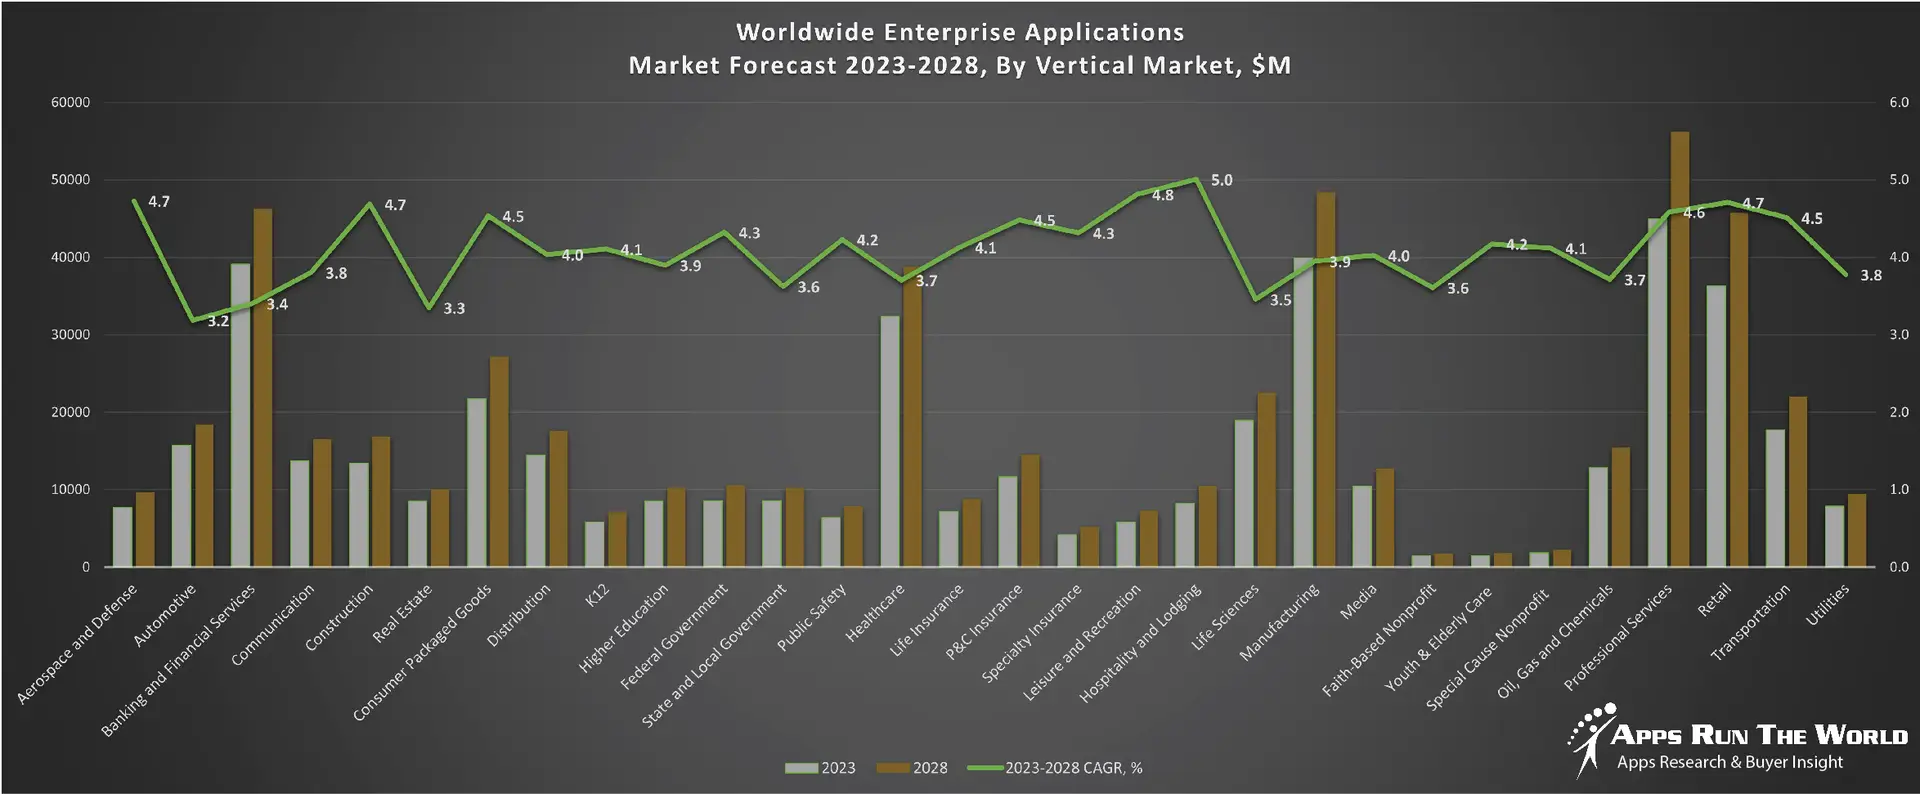
Exhibit 3 provides a forecast of the worldwide enterprise applications by vertical market from 2023 to 2028, highlighting market sizes, year-over-year growth, and compound annual growth rates across different industry sectors from Aerospace and Defense to Utilities.
Exhibit 3: Worldwide Enterprise Applications by Vertical Market Forecast 2023-2028 by Functional Market ($M)
Source: Apps Run The World, June 2024
Exhibit 4 shows our projections for the enterprise applications market by vertical segment, based on the buying preferences and the customer propensity to invest in new software within those industries as they continue to upgrade and replace many legacy industry-specific applications that have been identified and tracked in our Buyer Insight Database.
Consumer Packaged Goods Software Purchases Win/Loss Analysis As Part Of Enterprise Applications Buyer Insight Customer Database
On the buyer side, customers are investing in Consumer Packaged Goods systems based on new features and capabilities that are expected to replace their existing legacy systems. In many cases, competitive upgrades and replacements that could have a profound impact on future market-share changes will become more widespread.
Since 2010, our global team of researchers has been studying the patterns of the latest Consumer Packaged Goods software purchases by customers around the world, aggregating massive amounts of data points that form the basis of our forecast assumptions and perhaps the rise and fall of certain vendors and their products on a quarterly basis.
Updated continuously, our database features extensive win/loss analysis. Each year our research team identifies tens of thousands of these Consumer Packaged Goods customer wins and losses from public and proprietary sources.
The research results are being incorporated into regular updates in our Enterprise Applications Buyer Insight Customer Database. You can access the Quarterly Win/Loss Analysis Scoreboard and our Enterprise Applications Buyer Insight Customer Database by becoming a subscriber.
Source: Apps Run The World, June 2024
More Enterprise Applications Research Findings
Based on the latest annual survey of 3,000+ enterprise software vendors, Apps Run The World is releasing a number of dedicated reports, which profile the world’s 500 largest Enterprise Applications Vendors (Apps Top 500) ranked by their 2019-2023 product revenues.
Their 2023 results are being broken down, sorted and ranked across 16 functional areas (from Analytics to Treasury and Risk Management) and by 21 vertical industries (from Aerospace to Utility), as shown in our Taxonomy. Further breakdowns by subvertical, country, company size, etc. are available as custom data cuts per special request.
Research Methodology
Each year our global team of researchers conduct an annual survey of thousands of enterprise software vendors by contacting them directly on their latest quarterly and annual revenues by country, functional area, and vertical market. We supplement their written responses with our own primary research to determine quarterly and yearly growth rates, In addition to customer wins to ascertain whether these are net new purchases or expansions of existing implementations.
Another dimension of our proactive research process is through continuous improvement of our customer database, which stores more than one million records on the enterprise software landscape of over 100,000 organizations around the world.
The database provides customer insight and contextual information on what types of enterprise software systems and other relevant technologies are they running and their propensity to invest further with their current or new suppliers as part of their overall IT transformation projects to stay competitive, fend off threats from disruptive forces, or comply with internal mandates to improve overall enterprise efficiency.
The result is a combination of supply-side data and demand-generation customer insight that allows our clients to better position themselves in anticipation of the next wave that will reshape the enterprise software marketplace for years to come.
