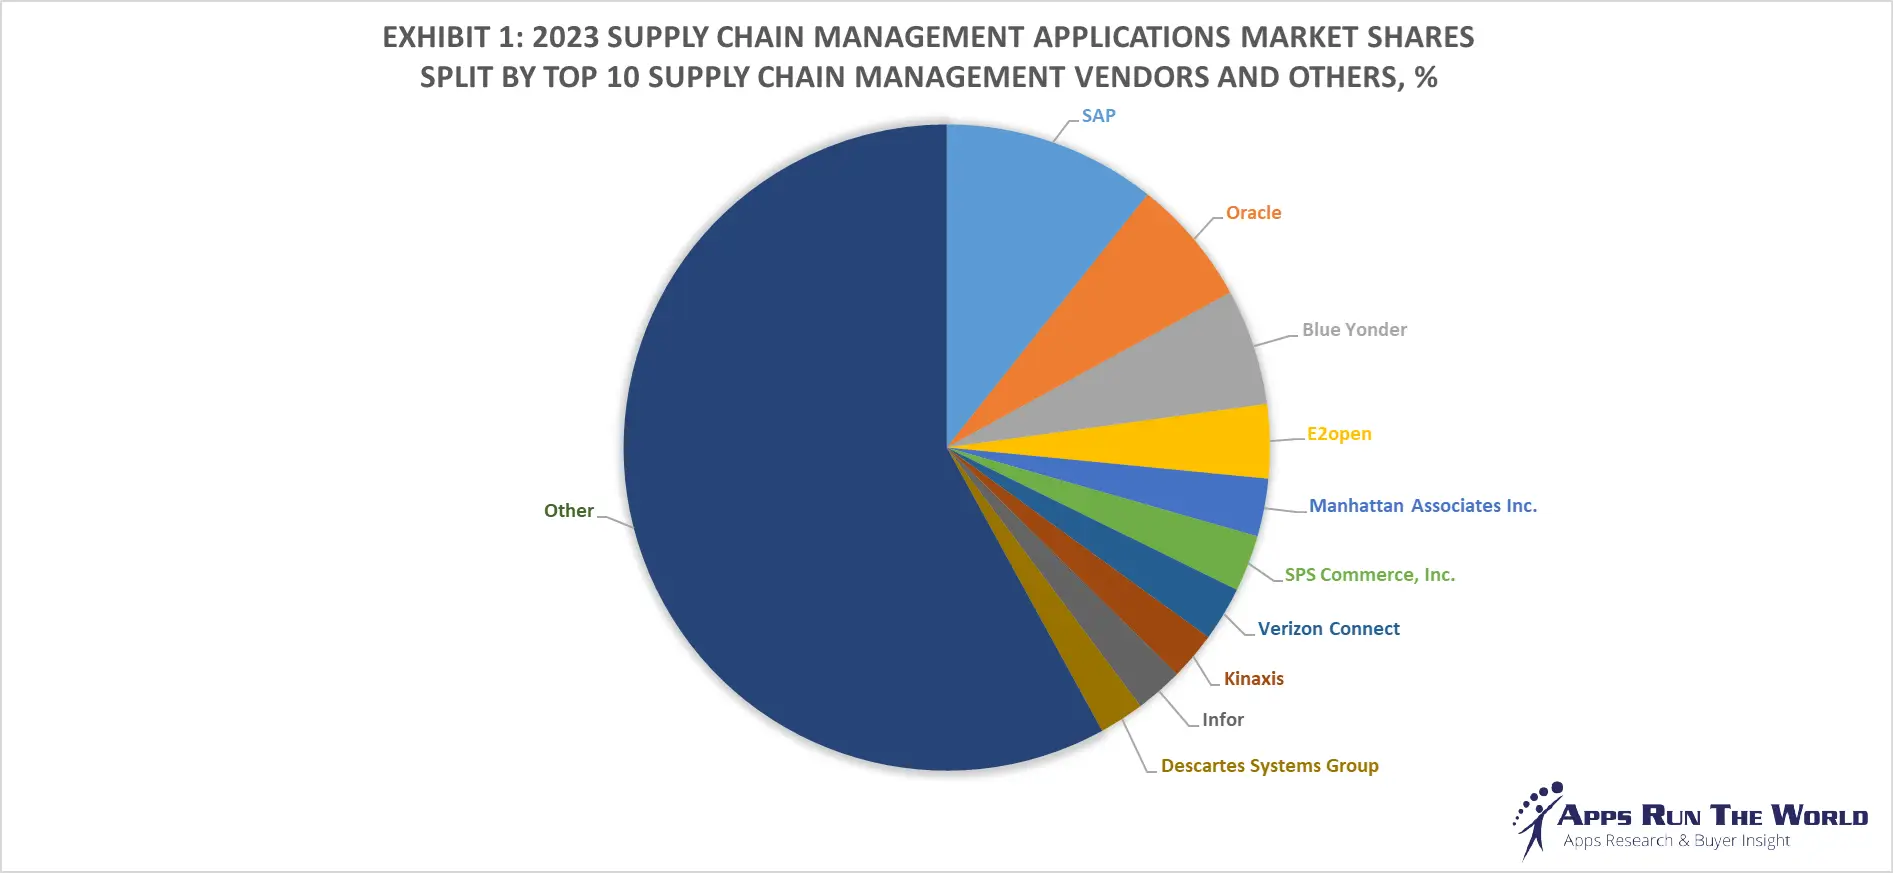
In 2023, the global Supply Chain Management (SCM) software market surged to nearly $13 billion, growing by 9.7%. The top 10 vendors commanded a significant 42% market share, with SAP leading at 10.7%, followed by Oracle, Blue YonderE2open, and Manhattan Associates.

Our APPS TOP 500 Market Report (Preview) covers hundreds of SCM software vendors, offering deep insights into market dynamics, vendor strengths, AI investments, customer momentum, and go-to-market strategies providing valuable perspectives on market trends and challenges.

Discover thousands of SCM Customer Wins with the ARTW Technographics Platform, an essential resource for technology enthusiasts, sales business leaders, and data-driven marketing executives, offering curated insights into the evolving landscape of the software industry, including the latest developments in SCM.

Exhibit 1 – 2023 SCM Applications Market Shares Split By Top 10 SCM Vendors and Others

Through our forecast period, the SCM applications market size is expected to reach $15.7 billion by 2028, compared with $13 billion in 2023 at a compound annual growth rate of 3.8%.

Exhibit 2: Worldwide SCM Software Market 2023-2028 Forecast, $M
Year202320282023-2028 CAGR, %
Total13010156683.8%

Source: Apps Run The World, June 2024

Top 10 SCM Software Vendors

Supply chain management covers Inventory Optimization (Warehouse Management, Replenishment), Transportation and Logistics (Routing, Scheduling, Carrier/Fleet/Fuel Management), Planning (Advanced Planning and Scheduling, Forecasting, Supply Chain Planning through Execution), Distribution Management (Order Orchestration, Management, Global Trade Management), E-Commerce (POS, Store Inventory & Fulfillment, EDI).

Internet of Things, global trade management are considered growth drivers, offset by retailing woes.

Here are the rankings of the top 10 SCM software vendors in 2023 and their market shares.

RankVendor Name2021 Supply Chain Management Apps Revenues, $M2022 Supply Chain Management Apps Revenues, $M2023 Supply Chain Management Apps Revenues, $MYoY Growth2023 Supply Chain Management Market Share, %
1SAP Subscribe Subscribe Subscribe5.7% Subscribe
2Oracle Subscribe Subscribe Subscribe7.3% Subscribe
3Blue Yonder Subscribe Subscribe Subscribe8.8% Subscribe
4E2open Subscribe Subscribe Subscribe25.0% Subscribe
5Manhattan Associates Inc. Subscribe Subscribe Subscribe17.2% Subscribe
6SPS Commerce, Inc. Subscribe Subscribe Subscribe11.0% Subscribe
7Verizon Connect Subscribe Subscribe Subscribe7.6% Subscribe
8Kinaxis Subscribe Subscribe Subscribe16.2% Subscribe
9Infor Subscribe Subscribe Subscribe4.8% Subscribe
10Descartes Systems Group Subscribe Subscribe Subscribe15.0% Subscribe
Subtotal Subscribe Subscribe Subscribe10.1% Subscribe
Other Subscribe Subscribe Subscribe9.4% Subscribe
Total1027711859130109.7%100.0%

Source: Apps Run The World, June 2024

Other SCM software providers included in the report are: abas Business Software, ABB, Access Group, Achilles, Adexa, Advanced, Aera Technology, AFAS ERP Software, Allscripts, American Software, Aptean, Aptos, Arkieva, Aspen Technology, CDK Global, Comarch SoftM, Concentra Analytics Ltd, Dematic, ENGIE Impact, Epicor, ESM Solutions, Exact Holding BV, Exela Technologies, Famous Software, FOURGEN Information Systems, Fourth Ltd, FuturMaster, GAINSystems, Generix Group, GEP, GHX, HCL Technologies Ltd., IBM, IFS, Ignite Technologies, Intelex Technologies, iptor, Kinaxis Inc., Kingdee, Unite (Formerly Mercateo Group), MercuryGate, NCR Corporation, NeoGrid, OM Partners, One Network Enterprises, ORTEC, Pitney Bowes, Pronto Software, QAD Inc., Quorum Software, Ramco Systems, Relex Solutions, River Logic, Inc., Roper Technologies, Sage, Sênior Sistemas, Slimstock, SmartERP, SPICA GROUP, SupplyOn, Symphony RetailAI, Synchronoss, Taulia, TechnologyOne Limited, Tecsys, Tigernix Pte Ltd, ToolsGroup, Tradeshift, Trimble, UNIT4, Vizient, Vormittag Associates Inc., Yonyou, and others.

Custom data cuts related to the SCM Applications market are available:

  • Top 250+ SCM Applications Vendors and Market Forecast 2023-2028
  • 2023 SCM Applications Market By Industry (21 Verticals)
  • 2023 SCM Applications Market By SCM Segments and Categories
  • 2023 SCM Applications Market By Country (USA + 45 countries)
  • 2023 SCM Applications Market By Region (Americas, EMEA, APAC)
  • 2023 SCM Applications Market By Revenue Type (License, Services, Hardware, Support and Maintenance, Cloud)
  • 2023 SCM Applications Market By Customer Size (revenue, employee count, asset)
  • 2023 SCM Applications Market By Channel (Direct vs Direct)
  • 2023 SCM Applications Market By Product
    Buyer Intent: Companies Reading this Research Report
    ARTW Buyer Intent uncovers actionable customer signals, identifying software buyers actively reading this research report. Gain ongoing access to real-time prospects and uncover hidden opportunities. Companies Actively accessing this research report include:
    1. KPMG India, a India based Banking and Financial Services organization with 40000 Employees
    2. Columbia University, a United States based Education company with 21489 Employees
    3. Sunset Hospitality Group (SHG), a United Arab Emirates based Leisure and Hospitality organization with 1500 Employees
    LogoCompanyIndustryEmployeesRevenueCountryEvaluated

    Worldwide Enterprise Application Market

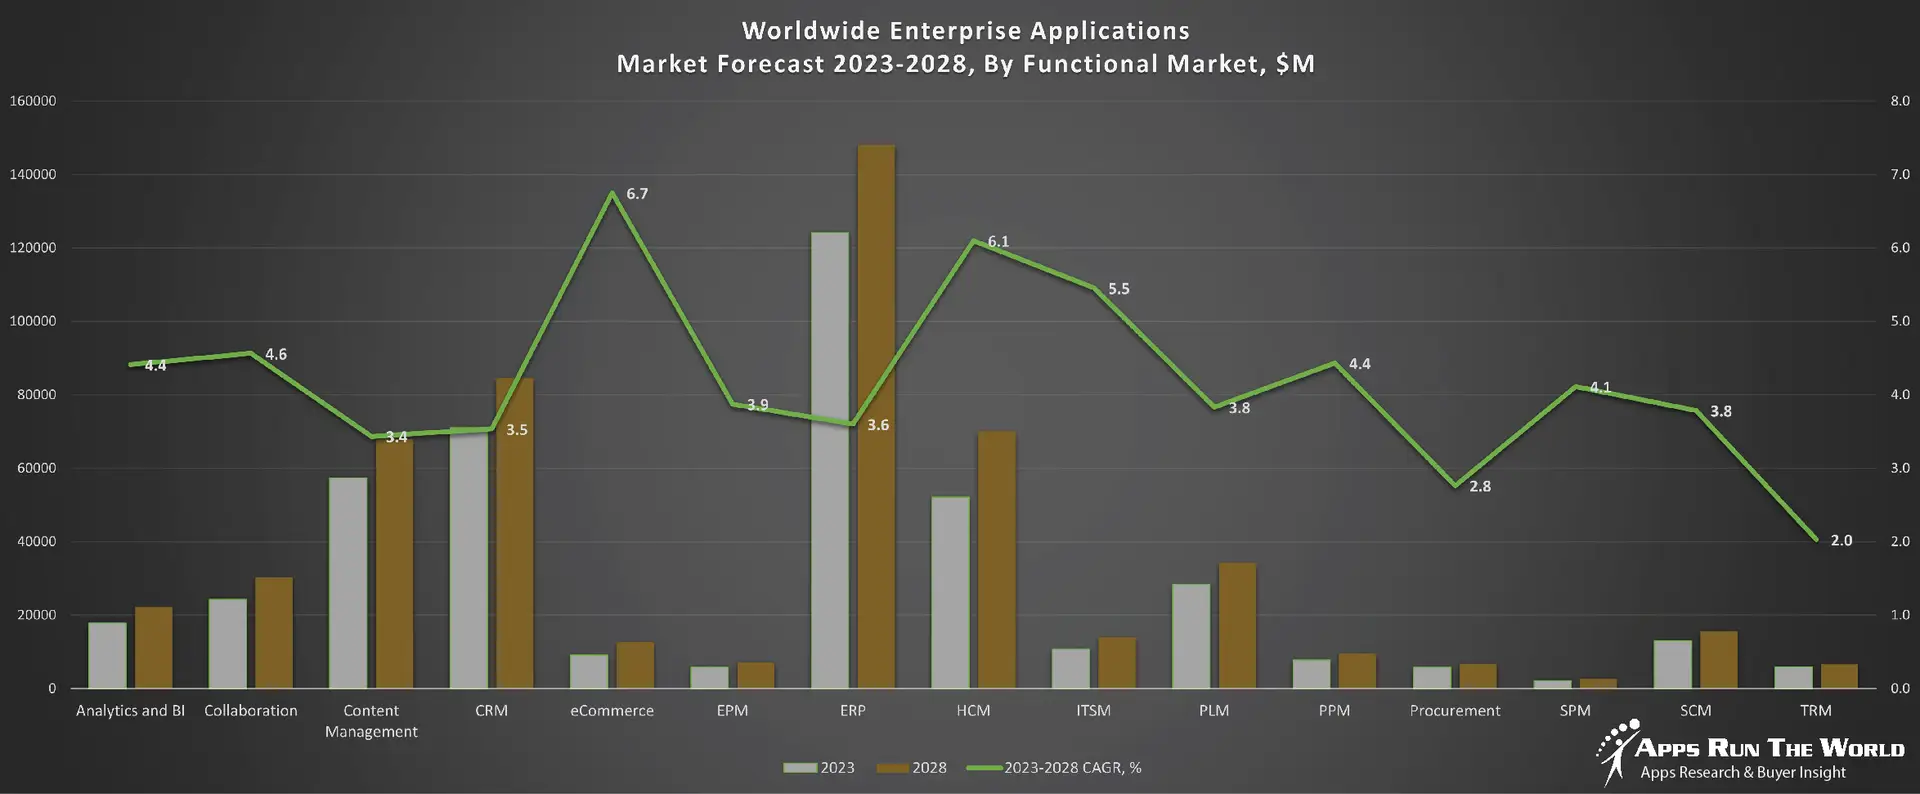
    Exhibit 3 provides a forecast of the worldwide enterprise application market from 2023 to 2028, highlighting market sizes, year-over-year growth, and compound annual growth rates across various functional segments. The data shows strong growth in emerging areas like eCommerce, Human Capital Management, and IT Service Management, while traditional segments like ERP and CRM continue to dominate in market size.

Exhibit 3: Worldwide Enterprise Application Market Forecast 2023-2028 by Functional Market ($M)

Functional Market, $M202120222023YoY Growth20282023-2028 CAGR, %
Analytics and BI Subscribe Subscribe Subscribe Subscribe Subscribe4.4
Collaboration Subscribe Subscribe Subscribe Subscribe Subscribe4.6
Content Management Subscribe Subscribe Subscribe Subscribe Subscribe3.4
Customer Relationship Management Subscribe Subscribe Subscribe Subscribe Subscribe3.5
eCommerce Subscribe Subscribe Subscribe Subscribe Subscribe6.7
Enterprise Performance Management Subscribe Subscribe Subscribe Subscribe Subscribe3.9
Enterprise Resource Planning Subscribe Subscribe Subscribe Subscribe Subscribe3.6
Human Capital Management Subscribe Subscribe Subscribe Subscribe Subscribe6.1
IT Service Management Subscribe Subscribe Subscribe Subscribe Subscribe5.5
PLM & Engineering Subscribe Subscribe Subscribe Subscribe Subscribe3.8
Project Portfolio Management Subscribe Subscribe Subscribe Subscribe Subscribe4.4
Procurement Subscribe Subscribe Subscribe Subscribe Subscribe2.8
Sales Performance Management Subscribe Subscribe Subscribe Subscribe Subscribe4.1
Supply Chain Management Subscribe Subscribe Subscribe Subscribe Subscribe3.8
Treasury and Risk Management Subscribe Subscribe Subscribe Subscribe Subscribe2.0
Total Subscribe Subscribe Subscribe Subscribe Subscribe4.1

Source: Apps Run The World, June 2024

Exhibit 4 shows the enterprise applications market by functional area. The highest growth functional markets revolve around smaller segments like eCommerce, Enterprise Performance Management, Sales Performance Management and Treasury and Risk, where first movers remain less established than those that for decades have been entrenched in functional areas like ERP, CRM and PLM.

Exhibit 4 – Worldwide Enterprise Applications Market Forecast 2023-2028, By Functional Market, $M

SCM Win/Loss Analysis As Part Of Enterprise Applications Buyer Insight Customer Database

On the buyer side, customers are investing in SCM systems based on new features and capabilities that are expected to replace their existing legacy systems. In many cases, competitive upgrades and replacements that could have a profound impact on future market-share changes will become more widespread.

Since 2010, our global team of researchers have been studying the patterns of the latest SCM software purchases by customers around the world, aggregating massive amounts of data points that form the basis of our forecast assumptions and perhaps the rise and fall of certain vendors and their products on a quarterly basis.

Updated continuously, our database features extensive win/loss analysis. Each year our research team identifies tens of thousands of these customer wins and losses from public and proprietary sources.

The research results are being incorporated into regular updates in our Enterprise Applications Buyer Insight Customer Database. You can access the Quarterly Win/Loss Analysis Scoreboard and our Enterprise Applications Buyer Insight Customer Database by becoming a subscriber.

CustomerIndustryEmpl.RevenueCountryVendorNew ProductCategory
CEAT TyresAutomotive8000$890.0MIndiaBlue YonderBlue Yonder Luminate PlanningSupply Chain Management
Escorts LimitedManufacturing10000$17.00BIndiaBlue YonderBlue Yonder Luminate PlanningSupply Chain Management
Lowe’s Companies, Inc.Retail300000$89.60BUnited StatesBlue YonderBlue Yonder Luminate PlanningSupply Chain Management
Nike, Inc.Consumer Packaged Goods73300$44.54BUnited StatesBlue YonderBlue Yonder Luminate PlanningSupply Chain Management
Metro AGRetail88306$30.54BGermanyBlue YonderBlue Yonder Advanced Store Replenishment (ex JDA Advanced Store Replenishment)Inventory Management
Dick’s Sporting Goods Inc.Retail15300$8.75BUnited StatesBlue YonderBlue Yonder Advanced Store Replenishment (ex JDA Advanced Store Replenishment)Inventory Management
ComcastCommunications168000$103.56BUnited StatesBlue YonderBlue Yonder Demand Planning (ex JDA Demand Planning)Demand Forecasting and Planning
Anheuser-Busch Companies, LLCConsumer Packaged Goods25000$15.62BUnited StatesBlue YonderBlue Yonder Enterprise Supply Planning (ex JDA Enterprise Supply Planning)Advanced Planning and Scheduling
Penske LogisticsConsumer Packaged Goods40000$9.00BUnited StatesBlue YonderBlue Yonder Transportation ManagementTransportation Management
Giltner, Inc.Transportation400$90.0MUnited StatesDescartes SystemsDescartes AljexTransportation Management
Detailresult Services B.V.Consumer Packaged Goods19800$2.19BNetherlandsDescartes SystemsDescartes Global Logistics NetworkLogistics Management
Etihad AirwaysTransportation24558$6.10BUnited Arab EmiratesDescartes SystemsDescartes Global Logistics NetworkLogistics Management
SteelcaseManufacturing12700$3.72BUnited StatesDescartes SystemsDescartes MacroPointReal-Time Transportation Visibility
Verso CorporationManufacturing3725$2.70BUnited StatesDescartes SystemsDescartes MacroPointReal-Time Transportation Visibility
U.S. Xpress Enterprise. Inc.Transportation8900$1.50BUnited StatesDescartes SystemsDescartes MacroPointReal-Time Transportation Visibility
Beacon Roofing Supply, Inc.Distribution7582$6.94BUnited StatesDescartes SystemsDescartes Transportation ManagerTransportation Management
NSK Europe LtdManufacturing4260$1.05BUnited KingdomDescartes SystemsDescartes Transportation ManagerTransportation Management
Dell Technologies Inc.Manufacturing158000$94.22BUnited StatesE2openE2Open Supply ManagementSupply Chain Management
PepsiCo, Inc.Consumer Packaged Goods291000$70.37BUnited StatesE2openE2Open Supply ManagementSupply Chain Management
Celestica Inc.Manufacturing18226$5.75BCanadaE2openE2Open Supply ManagementSupply Chain Management
Avon Products, Inc.Consumer Packaged Goods25000$5.00BUnited StatesE2openE2Open Supply ManagementSupply Chain Management
Maxim IntegratedManufacturing7131$2.31BUnited StatesE2openE2Open Supply ManagementSupply Chain Management
Georgia-Pacific LLCManufacturing71000$25.00BUnited StatesFlexportFlexport PlatformReal-Time Transportation Visibility
International Medical CorpsNon Profit7000$1.50BUnited StatesFlexportFlexport PlatformReal-Time Transportation Visibility
Ring IncManufacturing1300$850.0MUnited StatesFlexportFlexport PlatformReal-Time Transportation Visibility
Outdoor VoicesRetail300$100.0MUnited StatesFlexportFlexport PlatformReal-Time Transportation Visibility
NestléConsumer Packaged Goods273000$94.27BSwitzerlandInforInfor NexusSupply Chain Management
DHLTransportation38000$79.30BGermanyInforInfor NexusSupply Chain Management
RenaultAutomotive170158$51.67BFranceInforInfor NexusSupply Chain Management
Pfizer Inc.Life Sciences78500$41.91BUnited StatesInforInfor NexusSupply Chain Management
Harris RanchConsumer Packaged Goods450$60.0MUnited StatesInforInfor CloudSuite SCMSupply Chain Management
Yara InternationalOil, Gas and Chemicals16033$12.86BNorwayInforInfor CloudSuite SCMSupply Chain Management
Almajdouie Logistics CompanyTransportation5000$500.0MSaudi ArabiaInforInfor CloudSuite WMS (formerly Infor SCE)Warehouse Management
AdidasRetail59246$26.00BGermanyInforInfor Nexus Live TrackingReal-Time Transportation Visibility
Ariat InternationalConsumer Packaged Goods800$100.0MUnited StatesInforInfor Nexus Live TrackingReal-Time Transportation Visibility
Burton SnowboardsConsumer Packaged Goods1550$500.0MUnited StatesInforInfor Nexus Live TrackingReal-Time Transportation Visibility
Caterpillar Inc.Manufacturing97300$41.75BUnited StatesInforInfor Nexus Live TrackingReal-Time Transportation Visibility
Central Garden & Pet CompanyConsumer Packaged Goods7000$3.30BUnited StatesManhattan AssociatesManhattan Active Supply ChainSupply Chain Management
KIABIRetail10000$2.44BFranceManhattan AssociatesManhattan Active Supply ChainSupply Chain Management
TCI – Tokyo Chemical IndustryLife Sciences1500$1.00BJapanManhattan AssociatesManhattan Active Supply ChainSupply Chain Management
AmrodRetail1000$300.0MSouth AfricaManhattan AssociatesManhattan Active Supply ChainSupply Chain Management
3 SuissesRetail500$275.0MFranceManhattan AssociatesManhattan Active Supply ChainSupply Chain Management
PetSmart IncRetail56000$7.11BUnited StatesManhattan AssociatesManhattan Active OMNIOrder Management
TorridRetail5000$1.03BUnited StatesManhattan AssociatesManhattan Active OMNIOrder Management
AmerisourceBergen Corp.Healthcare41000$189.89BUnited StatesManhattan AssociatesManhattan WMSWarehouse Management
AT&T Inc.Communications226840$171.76BUnited StatesOracleOracle Cloud SCMSupply Chain Management
Facebook, Inc.Professional Services58604$85.97BUnited StatesOracleOracle Cloud SCMSupply Chain Management
United Parcel Service, Inc.Distribution540000$84.63BUnited StatesOracleOracle Cloud SCMSupply Chain Management
FedEx CorporationTransportation418000$83.96BUnited StatesOracleOracle Cloud SCMSupply Chain Management
General Electric CompanyManufacturing174000$79.62BUnited StatesOracleOracle Cloud SCMSupply Chain Management
Humana Inc.Insurance48700$77.16BUnited StatesOracleOracle Cloud SCMSupply Chain Management
Publix Super Markets, Inc.Retail225000$45.20BUnited StatesOracleOracle Warehouse Management CloudWarehouse Management
UnileverConsumer Packaged Goods148949$60.00BUnited KingdomOracleOracle Cloud SCMSupply Chain Management
Skanska ABConstruction and Real Estate33585$19.00BSwedenOracleOracle Cloud SCMSupply Chain Management
General Motors CompanyAutomotive155000$122.49BUnited StatesSAPSAP Supply Chain ManagementSupply Chain Management
Marathon Petroleum CorporationOil, Gas and Chemicals57900$69.78BUnited StatesSAPSAP Supply Chain ManagementSupply Chain Management
Valero Energy CorporationOil, Gas and Chemicals9964$64.91BUnited StatesSAPSAP Supply Chain ManagementSupply Chain Management
ABB AGManufacturing12000$3.20BGermanySAPSAP ERP ECC 6.0 – Materials Management (MM)Inventory Management
ADNOC DistributionOil, Gas and Chemicals8500$5.81BUnited Arab EmiratesSAPSAP ERP ECC 6.0 – Materials Management (MM)Inventory Management
Audi AGAutomotive90783$67.60BGermanySAPSAP S/4HANA EWM (Extended Warehouse Management)Warehouse Management
Archer-Daniels-Midland CompanyConsumer Packaged Goods38100$64.36BUnited StatesSAPSAP S/4HANA EWM (Extended Warehouse Management)Warehouse Management
Abbott LaboratoriesHealthcare109000$34.61BUnited StatesSAPSAP APO Demand PlanningDemand Forecasting and Planning
Amico GroupLife Sciences1300$448.0MUnited Arab EmiratesSAPSAP S/4 HANA – Materials Management (MM)Inventory Management
Apple, Inc.Manufacturing147000$274.52BUnited StatesSAPSAP S/4HANA Cloud SCMSupply Chain Management
Nike, Inc.Consumer Packaged Goods73300$44.54BUnited StatesSAPSAP S/4HANA Transportation ManagementTransportation Management
The Boeing CompanyAerospace and Defense141000$58.16BUnited StatesSAPSAP S/4HANA Transportation ManagementTransportation Management
Tyson Foods, Inc.Consumer Packaged Goods170$310.0MUnited KingdomSAPSAP S/4HANA Transportation ManagementTransportation Management
SonosManufacturing1427$1.33BUnited StatesSPS CommerceSPS Commerce Fulfillment (EDI)Supply Chain Management
Big 5 Sporting GoodsRetail9500$1.02BUnited StatesSPS CommerceSPS Commerce Fulfillment (EDI)Supply Chain Management
Pet Supplies PlusRetail2200$590.0MUnited StatesSPS CommerceSPS Commerce Fulfillment (EDI)Supply Chain Management
THE ICONICRetail1000$221.0MAustraliaSPS CommerceSPS Commerce Fulfillment (EDI)Supply Chain Management
Sierra SageHealthcare50$10.0MUnited StatesSPS CommerceSPS Commerce Fulfillment (EDI)Supply Chain Management
City Of HamiltonGovernment7132$1.45BCanadaVerizon ConnectVerizon ConnectFleet Management
National HMEBanking and Financial Services700$160.0MUnited StatesVerizon ConnectVerizon ConnectFleet Management
YRC FreightTransportation30000$4.50BUnited StatesVerizon ConnectVerizon ConnectFleet Management

Source: Apps Run The World, June 2024

More Enterprise Applications Research Findings

Based on the latest annual survey of 3,000+ enterprise software vendors, Apps Run The World is releasing a number of dedicated reports, which profile the world’s 500 largest Enterprise Applications Vendors (Apps Top 500) ranked by their 2019-2023 product revenues.

Their 2023 results are being broken down, sorted and ranked across 16 functional areas (from Analytics to Treasury and Risk Management) and by 21 vertical industries(from Aerospace to Utility), as shown in our Taxonomy. Further breakdowns by subvertical, country, company size, etc. are available as custom data cuts per special request.

Research Methodology

Each year our global team of researchers conduct an annual survey of thousands of enterprise software vendors by contacting them directly on their latest quarterly and annual revenues by country, functional area, and vertical market.

We supplement their written responses with our own primary research to determine quarterly and yearly growth rates, In addition to customer wins to ascertain whether these are net new purchases or expansions of existing implementations.

Another dimension of our proactive research process is through continuous improvement of our customer database, which stores more than one million records on the enterprise software landscape of over 100,000 organizations around the world.

The database provides customer insight and contextual information on what types of enterprise software systems and other relevant technologies are they running and their propensity to invest further with their current or new suppliers as part of their overall IT transformation projects to stay competitive, fend off threats from disruptive forces, or comply with internal mandates to improve overall enterprise efficiency.

The result is a combination of supply-side data and demand-generation customer insight that allows our clients to better position themselves in anticipation of the next wave that will reshape the enterprise software marketplace for years to come.